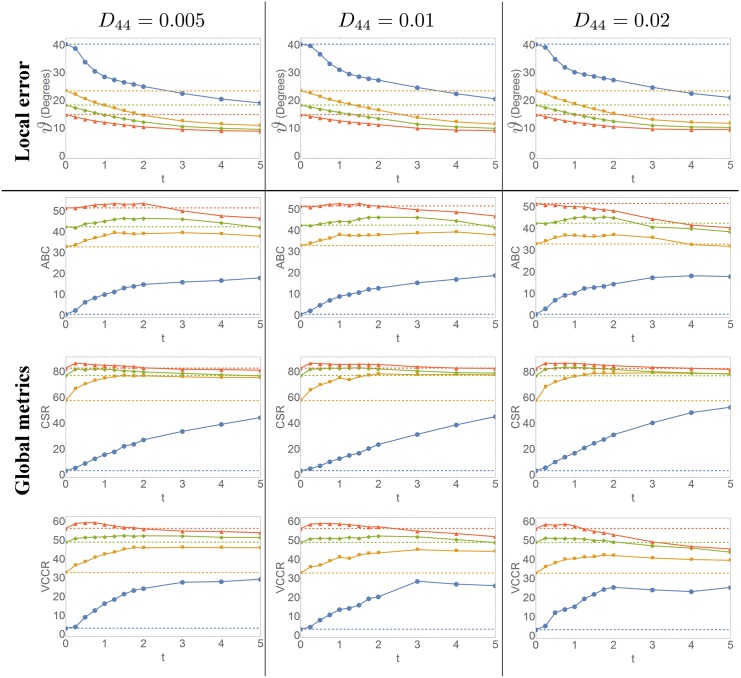
Fig 8. Quantitative evaluation of the effect of enhancements.
Evolution of the local error and global metrics for three different choices of D 44 and four different SNRs as we increase the diffusion time t. The top row shows the average angular error of the FOD peaks, the rows below show the average bundle coverage (ABC), connection to seed ratio (CSR) and the valid connection to connection ratio (VCCR), computed from the tractography results.

