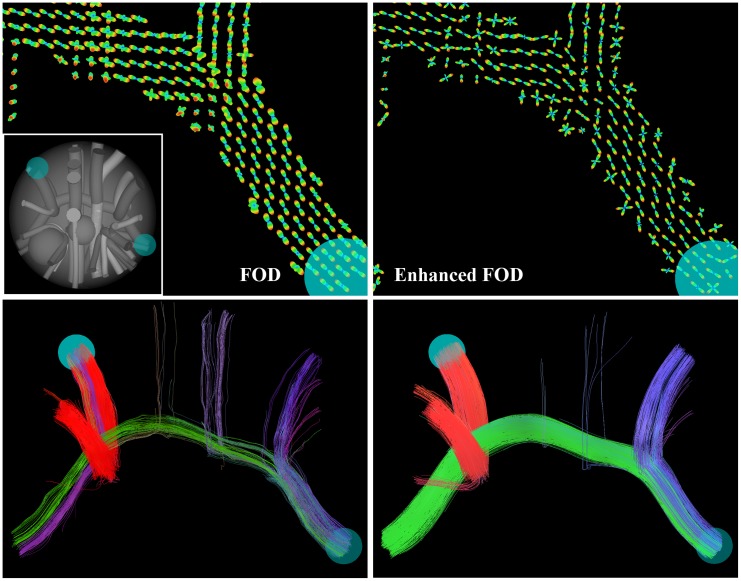
Fig 9. Comparison of CSD and enhanced CSD on the ISBI dataset.
The top row shows that glyphs visualizing the FOD are better aligned, especially at the boundary of the bundle. In this case, color corresponds to the radius of the glyph. The bottom row depicts the tractography results, showing only the streamlines that pass through the indicated spheres. Here the SNR = 4 and the parameters used for the enhancements are D 33 = 1.0, D 44 = 0.02, t = 4.0. The ground truth image with the same viewpoint as the bottom figures is depicted on the left.

