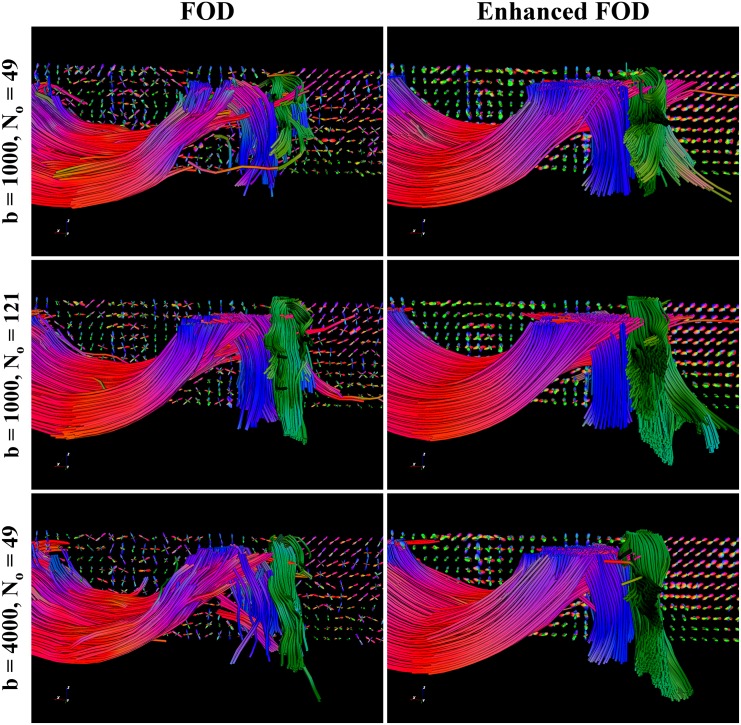
Fig 10. Comparison between CSD and enhanced CSD of tractography on human data.
The tractography results on CSD and enhanced CSD data of the corpus callosum (mostly red), coronia radiata (mostly blue) and superior longitudinal fasciculus (mostly green), with the color related to the fiber direction. Enhancements are performed with D 33 = 1.0, D 44 = 0.02, t = 4.0. All three bundles are more apparent after enhancements and more fibers pass the crossings.

