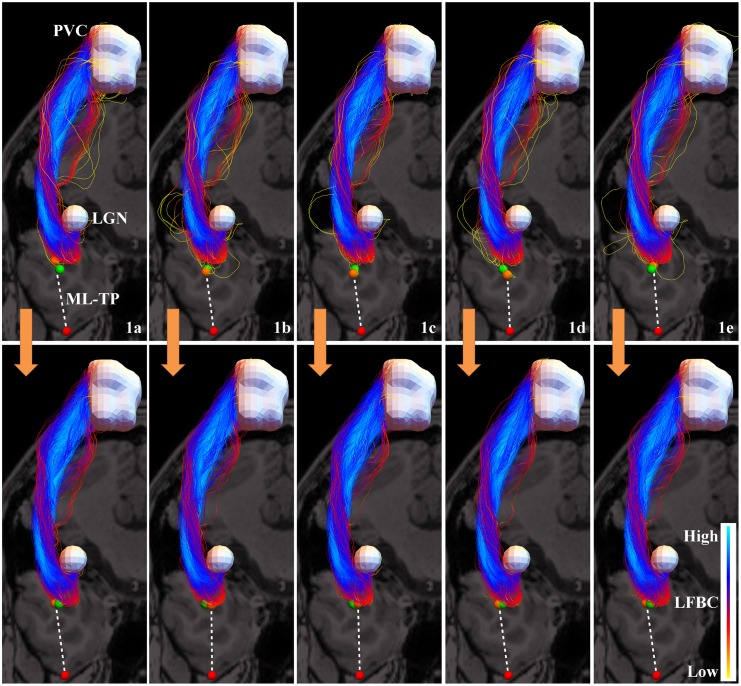
Fig 14. The effect of filtering spurious fibers from a probabilistic tractography on subject 1 in five different instances.
Top row: five different instances of the probabilistic tractography of the OR, viewed from the top, selecting only the 1000 most anterior fibers. Bottom row: the result after filtering the most spurious fibers for each of the instances. The red sphere indicates the temporal pole, the white volumes represent the LGN and the primary visual cortex. The orange spheres are the positions with minimal ML-TP distance. The green sphere indicates the position of the tip averaged over the five tractography results, before (top) or after filtering (bottom). There is less variation in the position of the tip of the Meyer’s loop in the bottom row, i.e. after filtering, than in the top row. The fiber bundle in the left upper corner is the same as the one in Fig 12.

