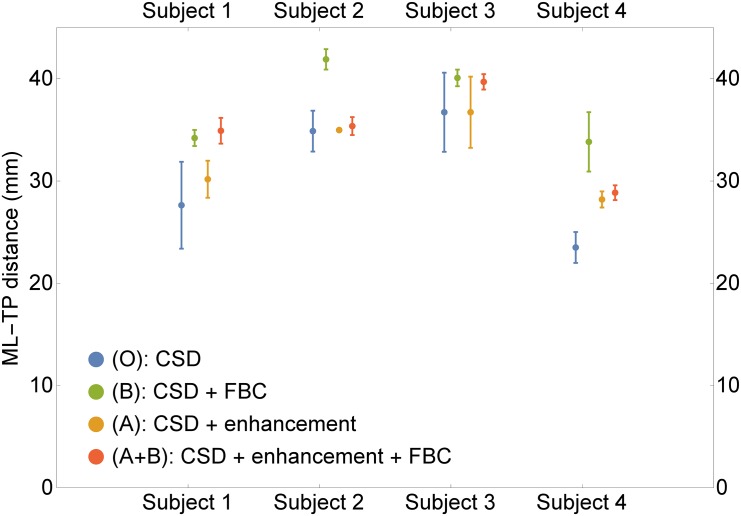
Fig 15. Boxplots of the ML-TP distances.
For the four subjects, we show the mean of the ML-TP distance over ten tractography results, plus two standard deviations. The four different methods are indicated with different colors. The combination CSD + enh + FBC is the most robust in producing stable results.

