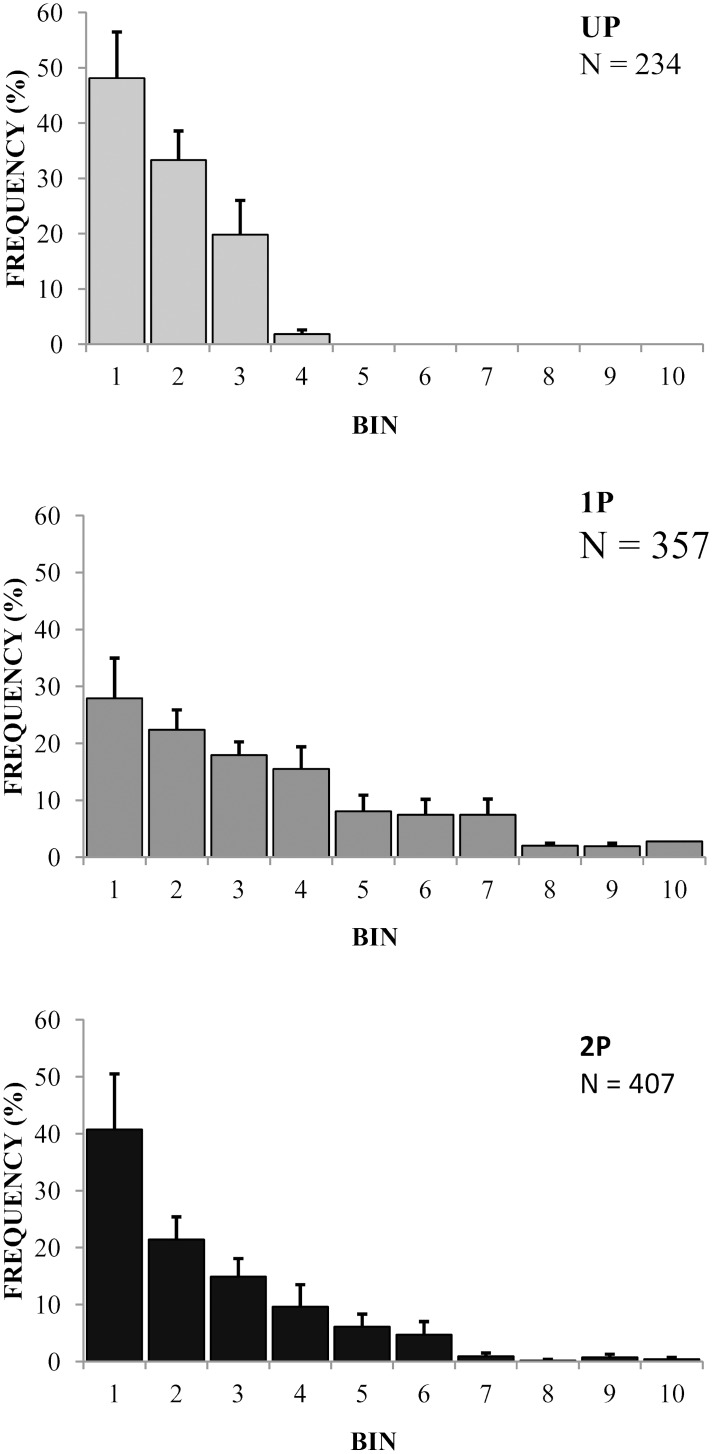
Fig 4. Amplitude distribution histograms for recordings in response to haemolymph from UP, 1P and 2P D. melanogaster larvae.
Each spike has been assigned to a 100 μV-amplitude bin in the range between 500 and 1500 μV (bins 1–10). Mean frequency of occurrence has been plotted; error bars are SEM. N refers to the total number of spikes for recordings in response to haemolymph of UP, 1P and 2P.

