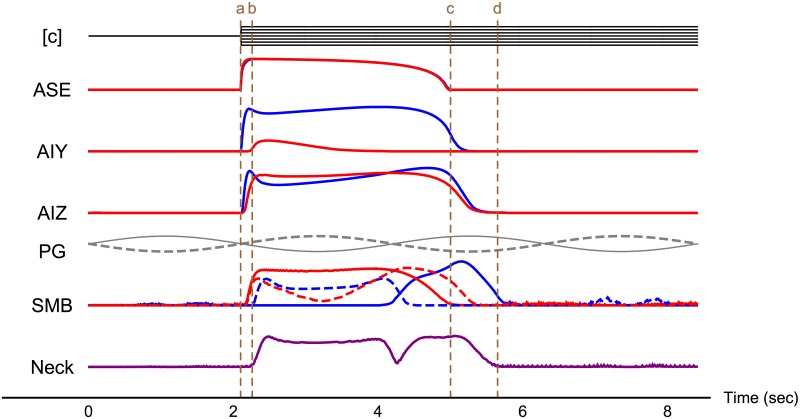
Fig 2. Overall flow of mutual information for concentration step assay.
The top row illustrates the input to the circuit, salt concentration [c] over time. Normalized mutual information is shown for each element of the system as a function of time. For each neuron class (ASE, AIY, AIZ, SMB), the blue and red traces represent the mutual information in the left and right cells, respectively. The purple trace represents the information in the neck. The gray traces represent the oscillatory input from the pattern generator (PG) to the ventral (solid) and dorsal (dashed) motor neurons. The dashed brown lines illustrate: onset of stimulus (a), onset of neck response (b), end of sensor response to stimulus (c), and end of neck response (d). Mutual information is shown for two full locomotion cycles (8.2 secs). Example neuron output traces can be seen in Fig 6 of our previous work [40].

