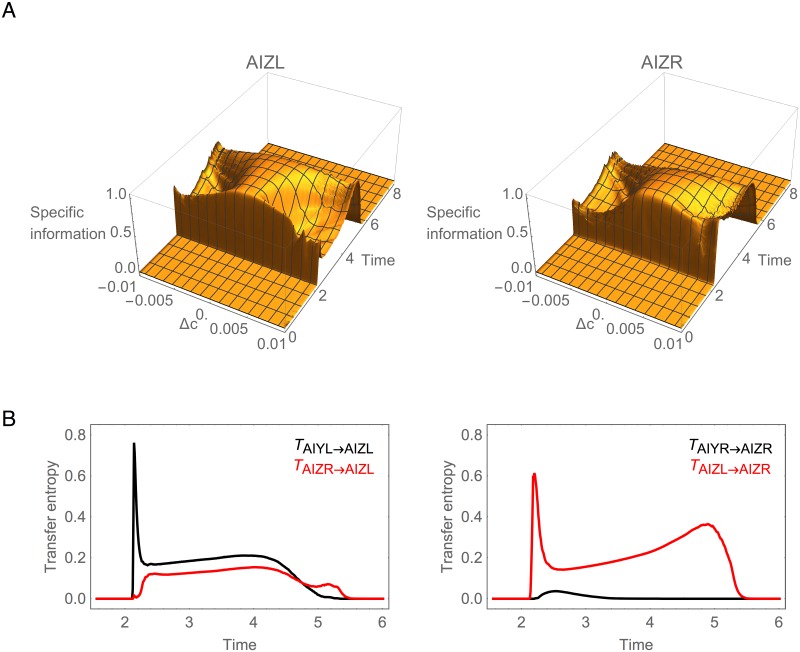
Fig 6. Information analysis for AIZ during concentration step assay.
(A) Specific mutual information for left, I(Δc = k;AIZL), and right, I(Δc = k;AIZR), cells over time. (B) Transfer entropy. Black trace represents the transfer of information from AIY to AIZ through the chemical synapse. Red trace represents the transfer of information from the contralateral AIZ cell through the gap junction.

