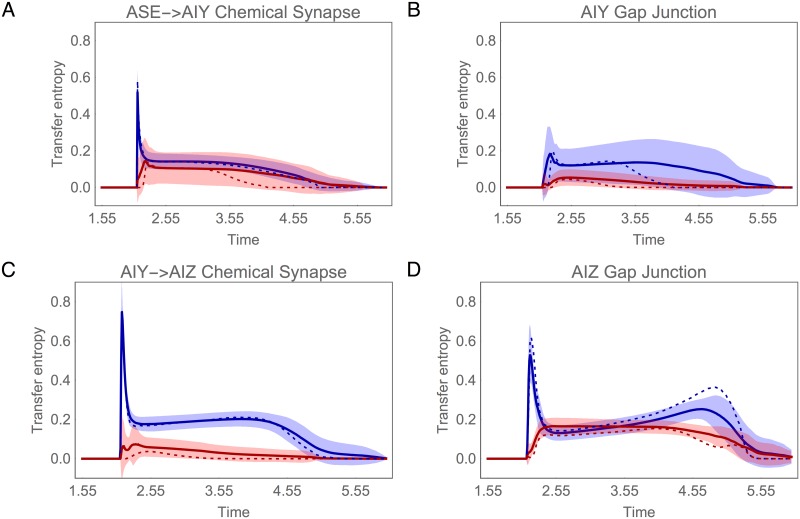
Fig 13. Transfer entropy in the population of successful circuits.
(A) Through chemical synapses from ASE to: AIY cell with most information (blue), and to the AIY cell with lowest information (red). The traces show the mean (solid trace) and standard deviation (shaded area) for the chemical synapses from both ASE cells. (B) Through chemical synapse from the AIY cell with most information to the AIZ cell downstream (blue), and from the AIY cell with lowest information to the AIZ cell downstream (red). (C) Through the AIY gap junction: from the cell with most information to the cell with lowest information (blue), vice versa (red). (D) Through the AIZ gap junction: from the cell downstream of the AIY cell most information to the cell downstream of the AIY cell with lowest information (blue), vice versa (red). Mean (solid trace) and standard deviation (shaded area) for the ensemble of successful networks. Transfer entropy for the best circuit shown as a dotted trace.

