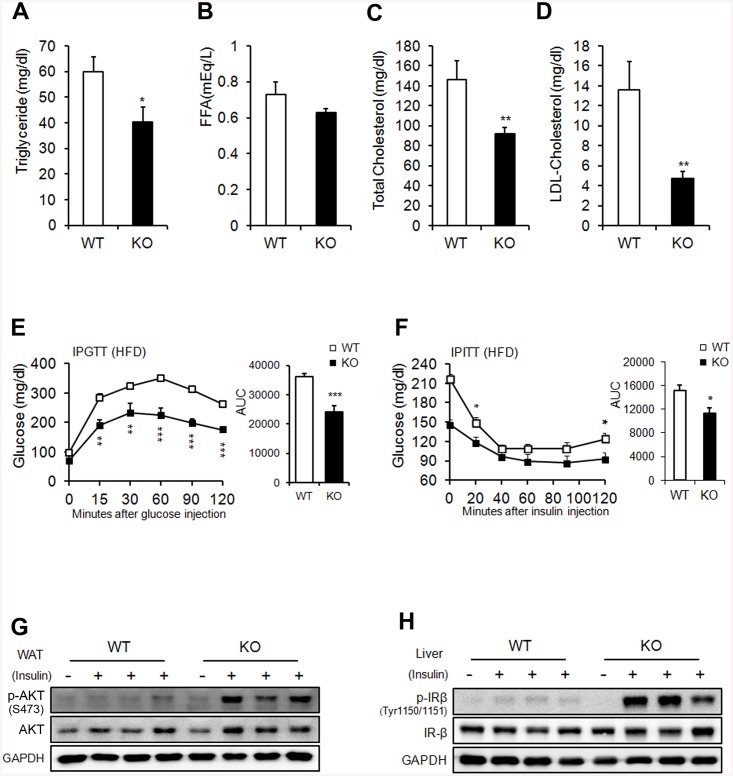
Fig 4. Metabolic parameters.
(A) Serum triglyceride. (B) FFA. (C) Total cholesterol. (D) LDL-cholesterol in WT and KO mice on an HFD. Serum levels were measured after a 16-h fasting period; n = 9/group (a-d). (E) Glucose tolerance after an 8-week HFD; n = 9 for WT and n = 6 for KO mice. (F) Insulin tolerance after an 8-week HFD; n = 6 for WT and n = 6 for KO mice. (G, H) Insulin signaling pathway in WAT (G) and liver (H). The data shown are the mean±SEM. *P<0.05, **P<0.01, ***P<0.001 between WT and KO mice.

