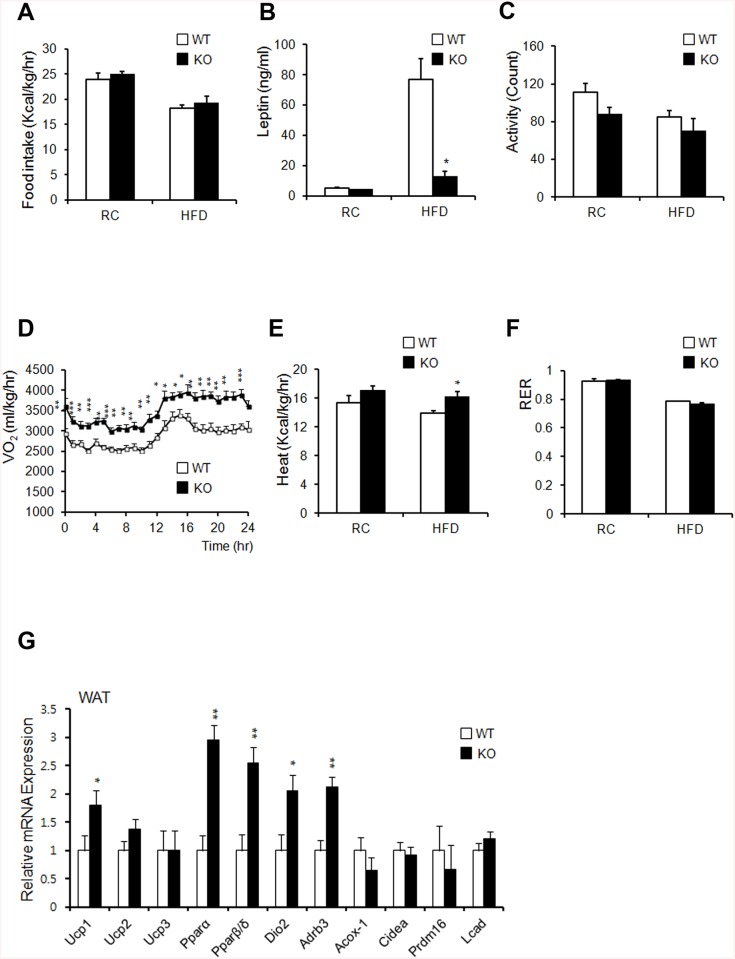
Fig 6. Ahnak-KO mice display increased energy expenditure.
(A) Food intake (WT: n = 6, KO: n = 5). (B) Serum leptin concentrations (n = 4). (C) Measurement of locomotor activity (WT: n = 6, KO: n = 5). (D) Whole-body oxygen consumption (VO2) over the course of 24 h (WT: n = 6, KO: n = 5). (E) Average value of heat generation (WT: n = 6, KO: n = 5). (F) The respiratory exchange rate was calculated as CO2 production/O2 consumption (WT: n = 6, KO: n = 5). (G) Relative mRNA expression of genes involved in energy dissipation and in brown adipose-specific genes in WAT, as measured by qPCR (n = 6). Values were normalized to 36B4 expression. The data shown are the mean±SEM; *P<0.05, **P<0.01, ***P<0.001.

