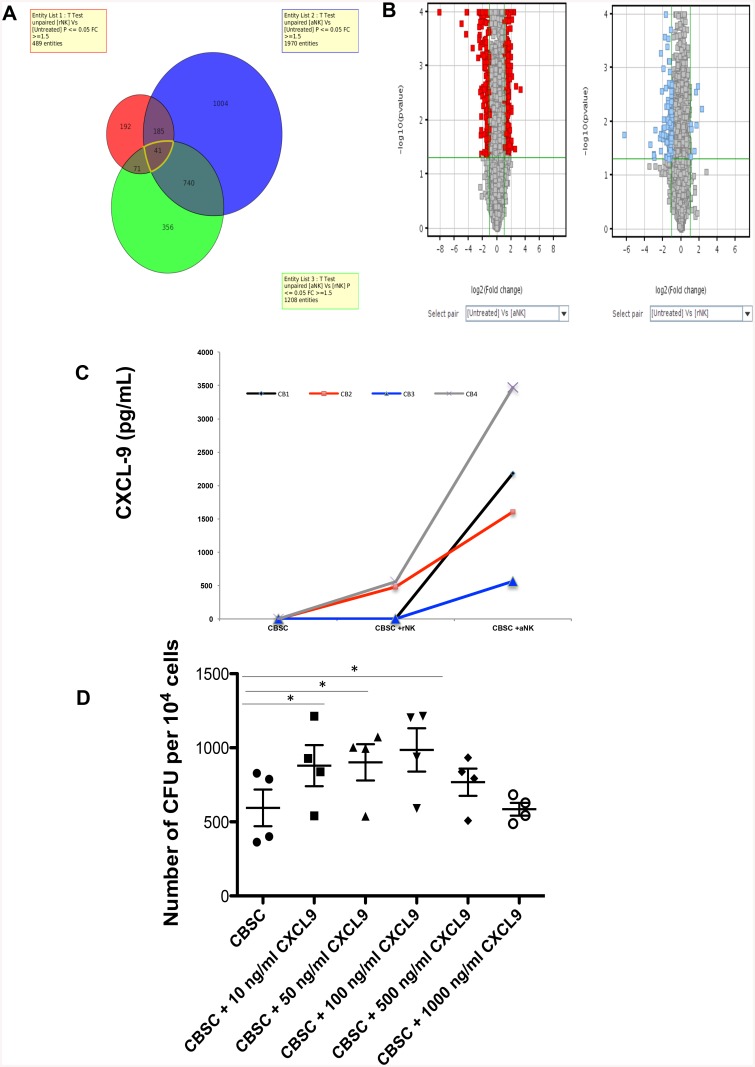
Fig 6. Changes in Gene and Protein Expression Induced in CBSC after Culture with Resting or Activated CB NK Cells.
(A and B) CBSC were cultured for 4 h either alone or with resting or activated CB NK cells and then CBSC were re-isolated by cell sorting based on CD34 expression (N = 3). Gene expression profiles were compared by microarray analysis using GeneChip human Gene 2.0 ST Arrays and normalized. Data is presented as a Venn diagram and Volcano plots comparing the number of CBSC genes for which expression was changed (either up or down-regulated) by greater than 1.5 fold (p ≤ 0.05) after culture with resting or activated CB NK cells in comparison to CBSC alone (untreated). Refer to S1 Table for specific changes in gene expression. (C) Validation of microarray data showing increased CXCL-9 expression by CBSC after culture with activated CB NK cells. CXCL-9 protein was measured in culture supernatants using ELISA after co-culture of CBSC alone or with resting or activated CB NK cells (N = 4). (D) CFU assays showing number of colonies formed after 4 h culture of CBSC with different concentrations of CXCL9 as indicated (N = 4), * P < 0.05.

