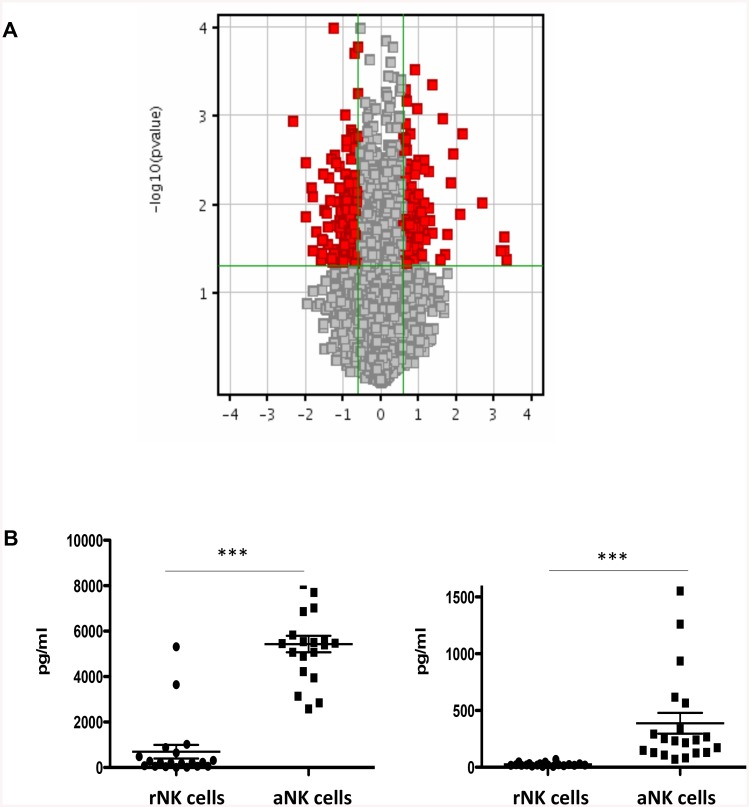
Fig 7. Changes in Gene and Protein Expression in NK Cells after Culture with IL-15.
(A) Gene expression profiles were compared by microarray analysis using GeneChip human Gene 2.0 ST Arrays and normalized. Data is presented as a Volcano plot comparing the number of genes for which expression was changed (either up or down-regulated) by greater than 1.5 fold (p ≤ 0.05) between rNK cells and aNK cells. Refer to S2 Table for specific changes in gene expression. (B) IFN-γ and TNF-β secretion by NK cells was measured by ELISA following activation with IL-15 (N = 24) to confirm microarray data, *** P < 0.001.

