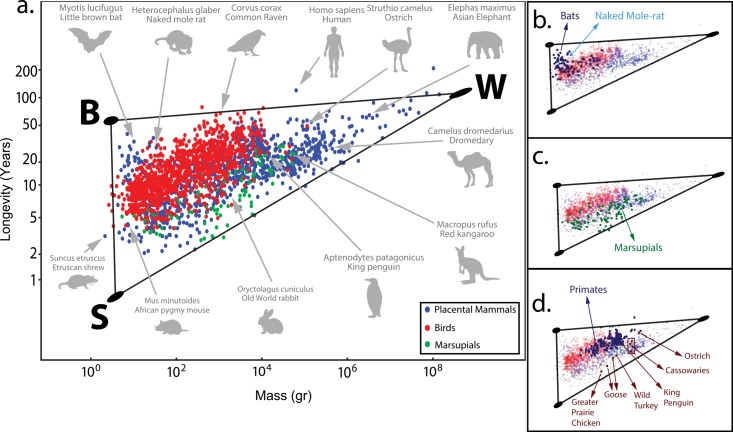
Fig 2. The longevity-mass data set is well described by a triangle in log space.
(a) Placental mammals (blue), birds (red) and marsupials (green) are presented in a log-log plot, black lines represent the best fit triangle and the three ellipses on the vertices represent the position and error of the archetypes determined by bootstrapping (see Methods). (b) Bats, naked mole rat are close to the B archetype. (c) Marsupials cover much of the same triangle. (d) Primates are close to the B archetype, flightless birds are far from it.

