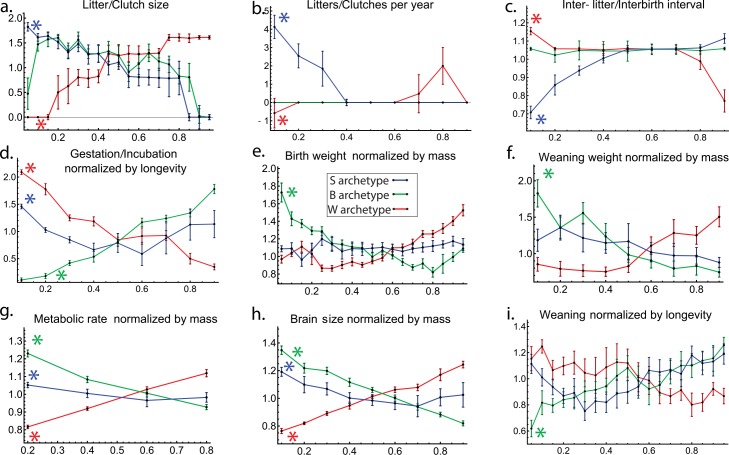
Fig 3. Each archetype is enriched with specific life-history traits.
Trait values are plotted versus distance from an archetype. Species were binned to equal sized bins according to distance from an archetype. Median trait value in the bin normalized by median trait value in the dataset is shown, error bars are from bootstrapping. Curves for features enriched significantly at an archetype are marked with an asterisk (listed also in Table 3). Bin size selection is explained in S3 Text.

