
FIGURE 3.
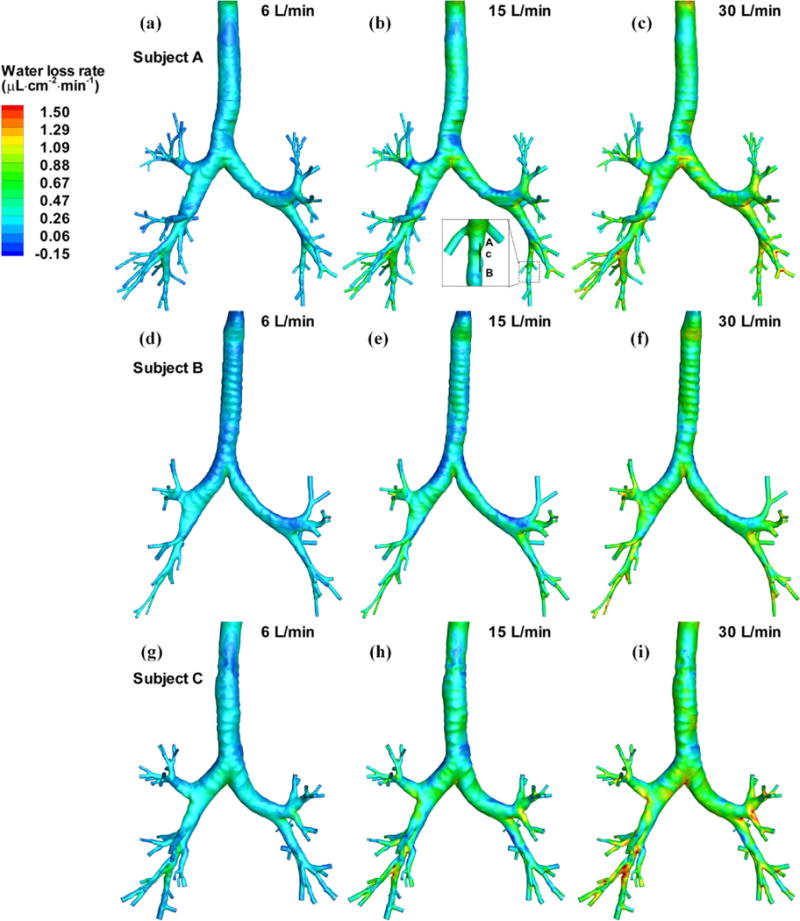
Distributions of the water loss rates of three subjects at three minute ventilations. The data along line AB in the insert of (b) are extracted for further analysis in Fig. 8.
Official websites use .gov
A
.gov website belongs to an official
government organization in the United States.
Secure .gov websites use HTTPS
A lock (
) or https:// means you've safely
connected to the .gov website. Share sensitive
information only on official, secure websites.
Distributions of the water loss rates of three subjects at three minute ventilations. The data along line AB in the insert of (b) are extracted for further analysis in Fig. 8.