
Figure 2.
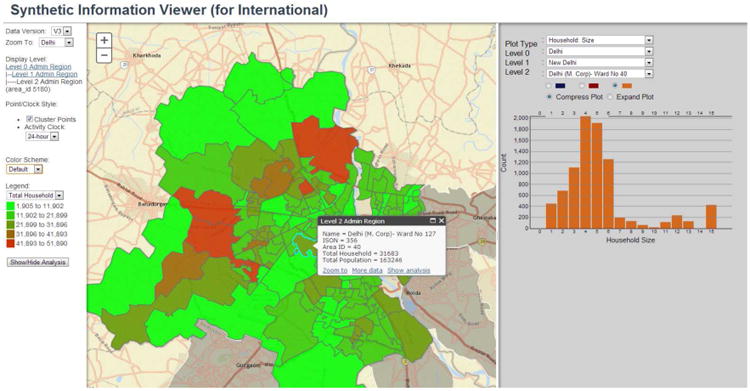
Our laboratory has developed an interactive web-based graphical tool called Synthetic Information Viewer to visualize the synthesized population. The figure shows a map of Delhi and its 114 wards. For example, clicking on ward No. 40 shows the statistics of synthetic households in the ward, which comprise of 31,683 households and 163,246 individuals. The right panel displays the household size distribution for the synthetic households in ward No. 40.