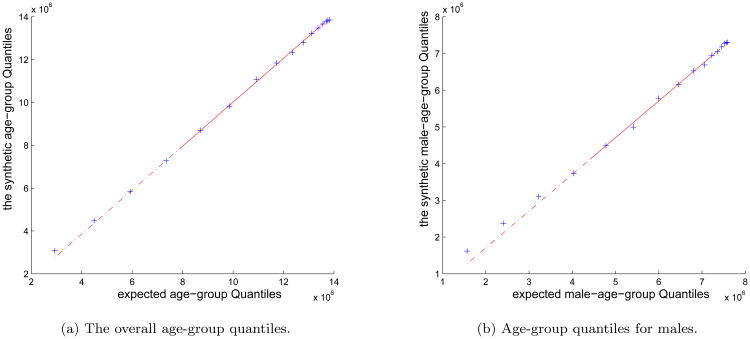
Figure 6.
Q-Q plots of the age-group quantiles for the synthetic Delhi population. In Figure 6a, the age-group quantiles of the synthetic population conform very well with the expected value based on the census data. A slight but acceptable deviation from 45 degree line is observed in the males only curve (see Figure 6b)

