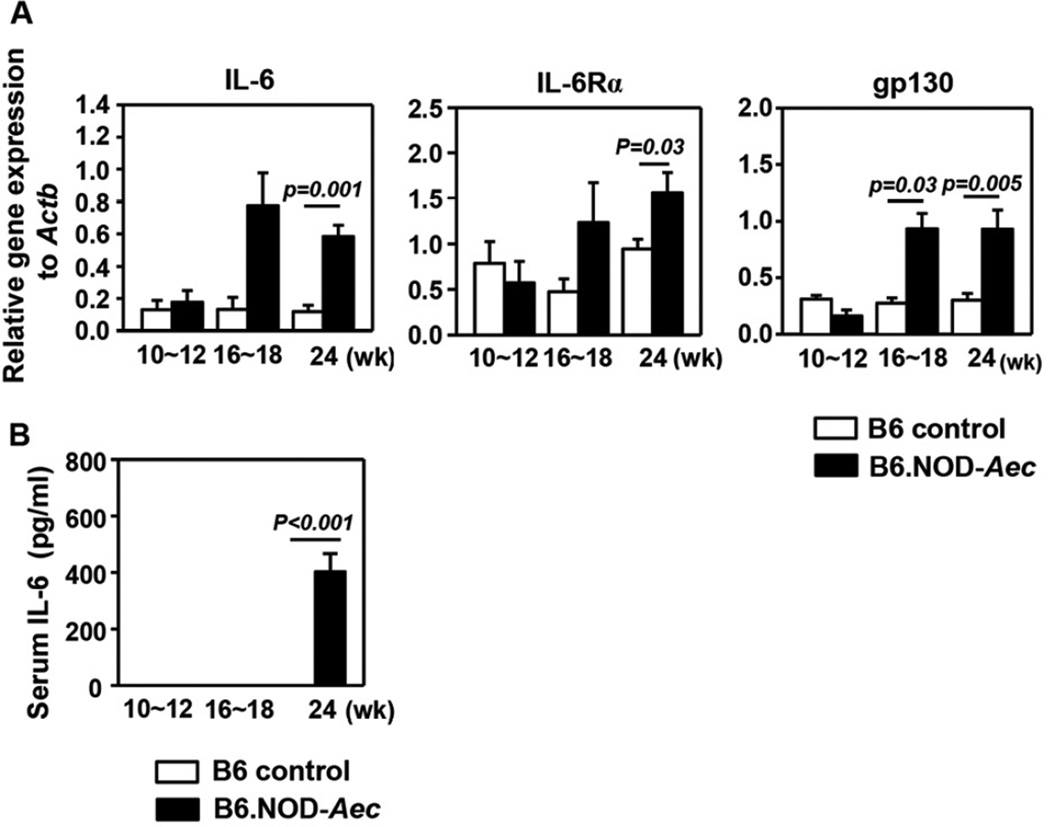
Figure 1. Expression of IL-6 and its receptor in the SMG of B6.NOD-Aec mice.
(A) IL-6, IL-6Rα and gp130 mRNA levels in the SMG of B6 or B6.NOD-Aec mice aged 10–12, 16–18 and 24 weeks. Expression levels were presented relative to that of β-actin. (B) Serum IL-6 concentrations in the same mice described above. Data are the average of analyses of at least 6 mice for each group from 3 independent experiments. The histograms and error bars represent the average and SEM, respectively.

