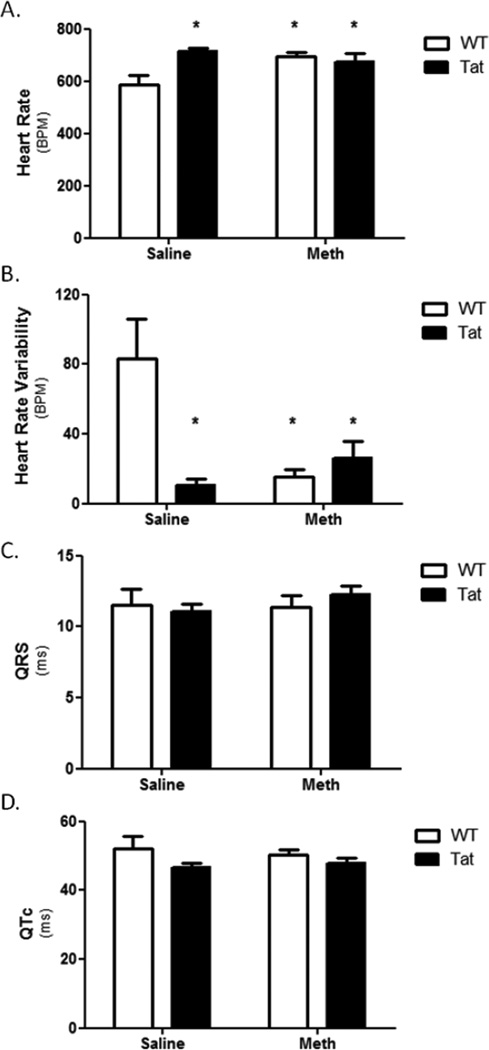
Figure 2. Electrocardiogram of Tat and METH mice.
ECG was performed one hour after the final METH or vehicle (day 10). Heart rate (A) was elevated in Tat-saline, WT-METH, and Tat-METH mice compared to WT-saline mice, while heart rate variability (B) was reduced in all three experimental groups compared to WT-saline. No changes in QRS or QTc were identified following 10 days of METH or saline. * denotes p<0.05 compared to WT-saline mice.

