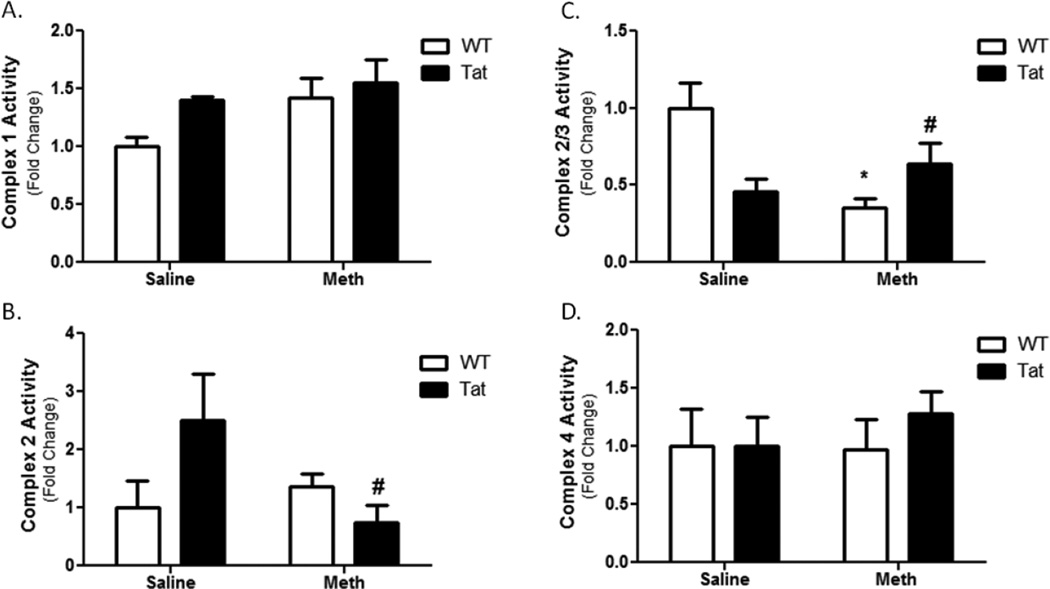
Figure 4. Mitochondrial Electron Transport Chain Complex Activity.
Complexes of the mitochondrial electron transport chain were assessed. No change was observed in Complex 1 (A). No statistical change in complex 2 activity was caused by Tat mice or METH alone, but a significant interaction was observed between METH and Tat during co-administration (B). Though this interaction was significant, there was not a statistically significant change in Tat-METH Complex 2 activity compared to controls. The Complex 2/3 assay showed a significant decrease with the METH-treated WT (C). Interestingly, the combined presence Tat and METH led to an increase in complex 2/3 activity. No change was observed in Complex 4 (D). * denotes p<0.05 compare to WT-saline mice by one-way ANOVA; # denotes a significant interaction (p<0.05) between Tat and METH by two-way ANOVA.

