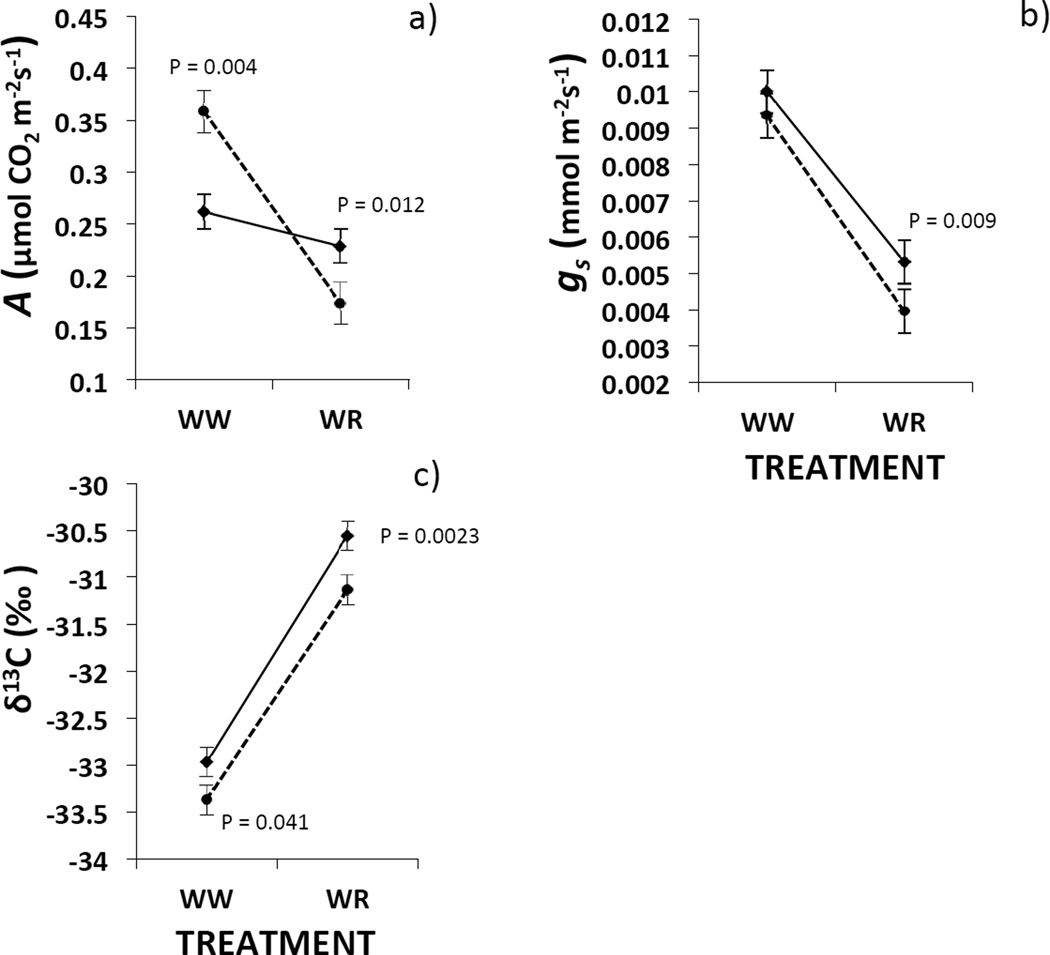
FIGURE 1.
Variation (LS-MEANS adjusted model values ± 1 SE) in a) whole plant photosynthesis (A); b) stomatal conductance (gs); c) carbon isotope composition (δ13C ‰) between two watering treatments (WW = well watered, WR = water restricted) and two levels of ploidy variation: B.distachyon diploids (dashed line) and B. hybridum allotetraploids (solid line). P-values in the graphs are results from test of the slices interactions comparing both ploidy levels in each treatment. Only results from significant tests are shown.

