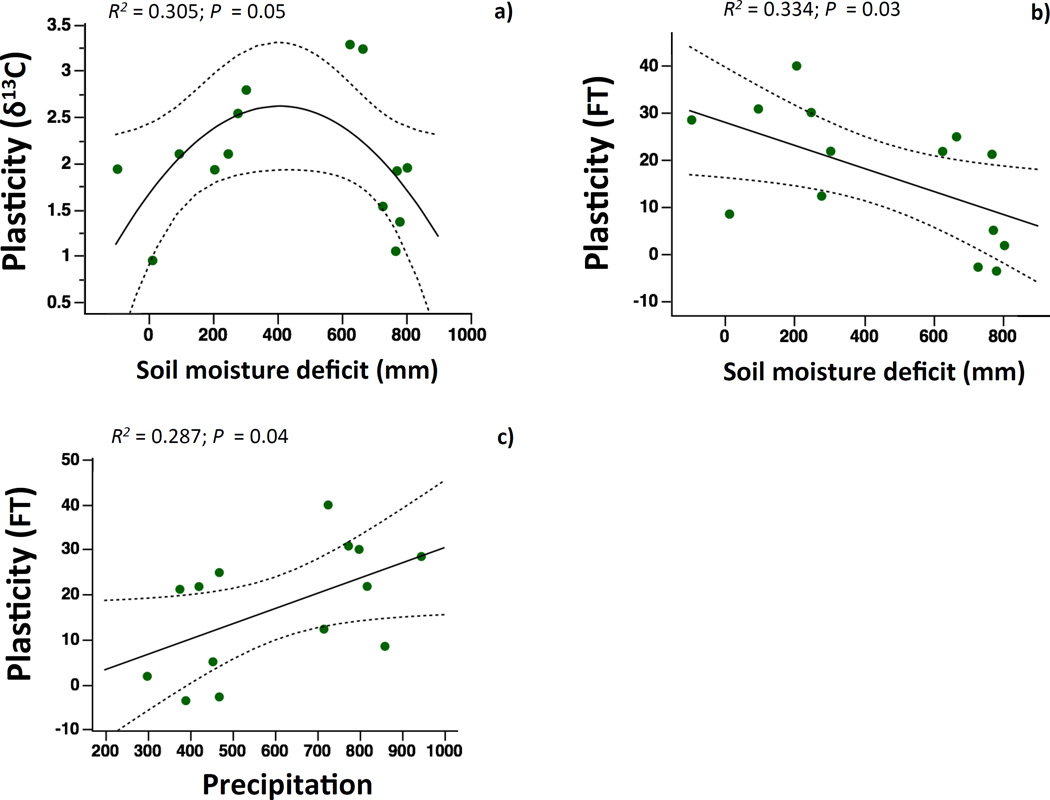
FIGURE 4.
Relationships between annual precipitation, annual soil moisture deficit and population means of plasticity in ecophysiological traits: a) carbon isotope composition; b,c) flowering time (FT). Soil moisture deficit is defined as potential evapotranspiration minus precipitation. Plasicity values come from trait differences between the two watering treatments. In all cases, solid lines depict the best linear or quadratic regression fit between variables. Only data for B. distachyon diploids are depicted by green circles in the graphs.

