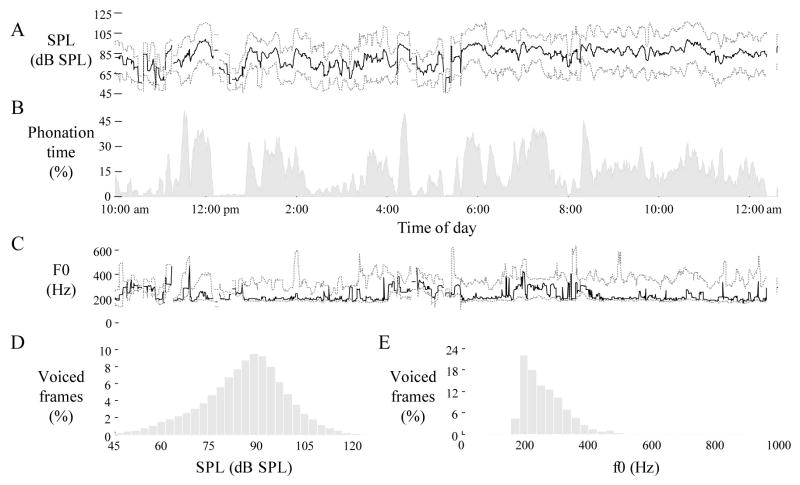
Figure 2.
Daylong voice use profile for an 18-year-old voice student with vocal fold nodules. Values are plotted across five-minute sliding windows for (A) sound pressure level (SPL) at 15 cm, (B) phonation time, and (C) fundamental frequency (f0). Dotted lines represent minimum (5th percentile) and maximum (95th percentile) values. Solid lines represent mean and mode statistics for SPL and f0, respectively. Histograms are also displayed for (D) SPL and (E) f0 as percentages of voiced frames over the entire day.

