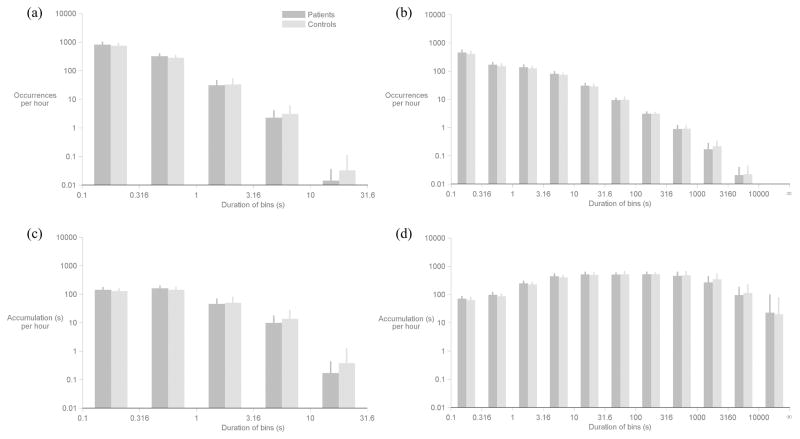
Figure 3.
Comparison of occurrence and accumulation histograms between patient (dark gray) and control (light gray) groups. Occurrence histograms are shown separately for (a) voiced and (b) non-voiced segments. Accumulation histograms are also shown separately for (c) voiced and (d) non-voiced segments. Error bars denote one standard deviation above the mean. No statistically significant differences (p < 0.003) were found between patient-control pairs within any bin.

