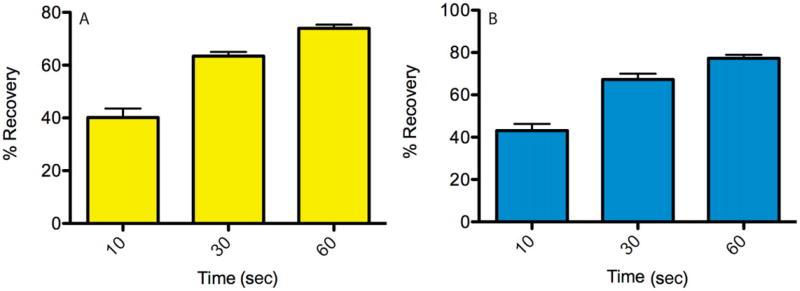
Figure 24.5.8.
Fluorescence recovery after photobleaching (FRAP) experiment was performed on supported lipid bilayers containing either 100 molecules/mm2 of CD80-YFP-CD28TM-ΔWΔT (A) or CD80-CFP-CD28TM-ΔT (B). The laser beam was focused to a diffraction-limited spot in the bilayer plane by filling the back aperture of the objective and was used to perform photobleaching in a small area. Images of the bilayers were collected before, immediately at, and after indicated times after photobleaching. Percentage recovery was calculated from background-subtracted images using the formula %recovery = [(intensity(t) – intensitypostbleach)/(intensityprebleach)] × 100, where the intensities are average fluorescence intensities from an area bounding the bleach spot. Data are average and standard deviation from six independent bleach spots.

