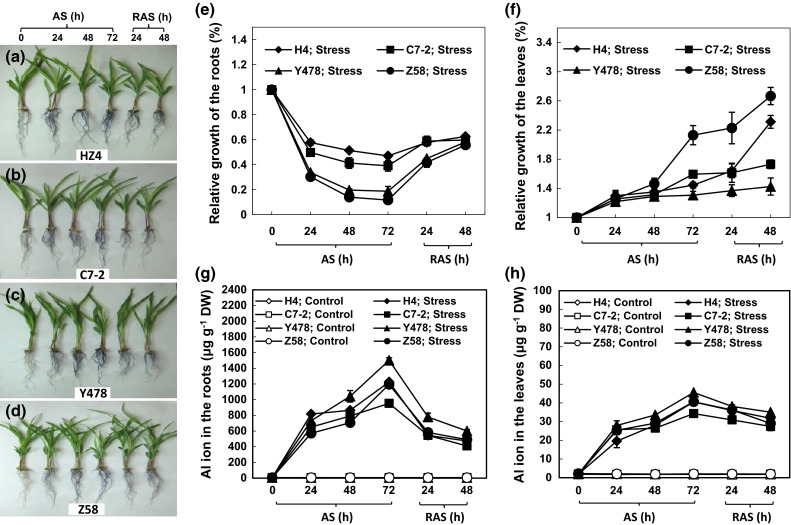
Fig. 1.

The growth of maize seedlings under AS and after RAS. The phenotypes of the different maize lines (a–d), the relative growth of roots (e) and leaves (f), and the Al ion contents in roots (g) and leaves (h). The values are mean ± standard error (SE) from at least five individual seedlings
