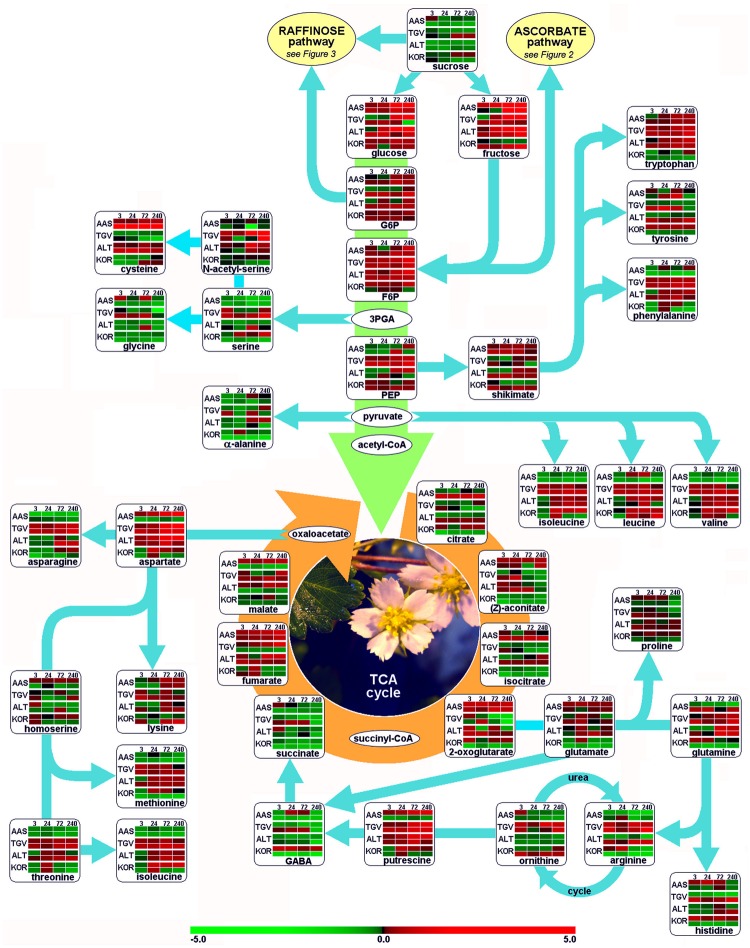
FIGURE 1.
Functional regulation of primary metabolism. Glycolysis, citric acid cycle (TCA), and amino acid biosynthesis are depicted as pathway map. Leaf and root samples of Fragaria x ananassa (KOR: cv. ‘Korona’) harvested at different time points after cold treatment (0, 3, 24, 72, and 240 h), are compared to those of the diploid F. vesca cultivars; AAS (cv. Ås, Southern, continental Norway), TGV (cv. Tingvoll, coastal Mid-Norway) and ALT (cv. Alta, Northern Norway). Colors in metabolite arrays represent ratio values based on the median of the initial time point (t0, n = 5) of each genotype × plant organ combination. The upper row from paired rows of each genotype represents leaf samples, the lower row the roots. Green colors indicate down-regulation of metabolites, red colors up-regulation (see color scale). Metabolite colors (intensities) were generated using the MultiExperiment Viewer software v.4.4 (Saeed et al., 2003). 3PGA, 3-phosphoglyceraldehyde; F6P, fructose-6-phosphate; G6P, glucose-6-phosphate; GABA, 4-aminobutyric acid; PEP, phosphoenolpyruvate.

