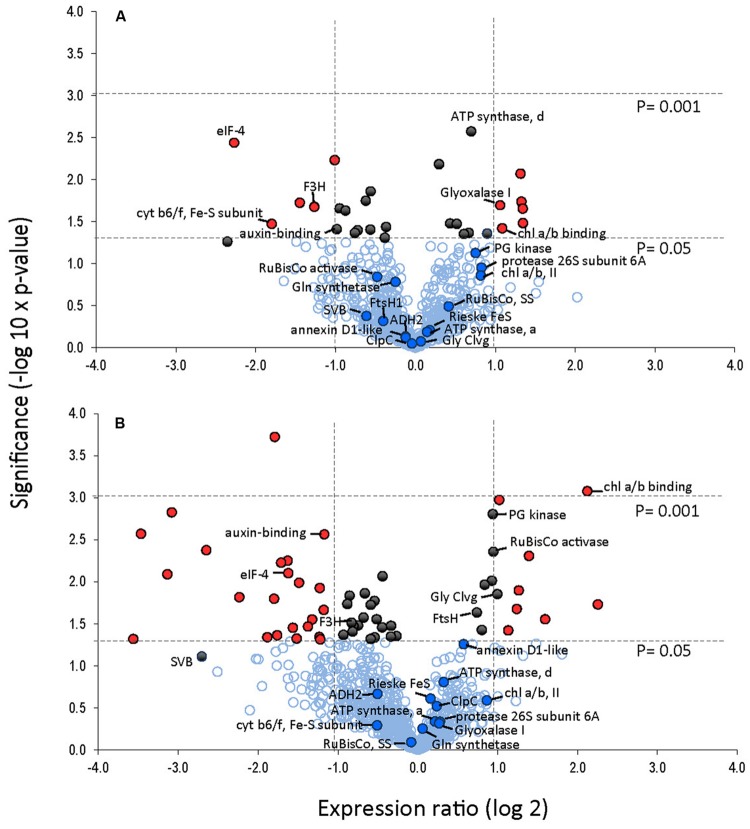
FIGURE 7.
Protein expression levels in leaves after 24 and 240 h of cold treatment (A, B), respectively. Volcano plot was obtained by plotting the log2 ratio of mean values (24 or 240 h cold treatment over control) for the 845 matched 2DE spots against the negative log10 of the p-value from the Student’s t-test. Proteins that changed twofold or more with a significance of p-value <0.05 are indicated with red. Proteins that changed significantly (p < 0.05) but changed less than twofold are indicated in black. Identified proteins are indicated.

