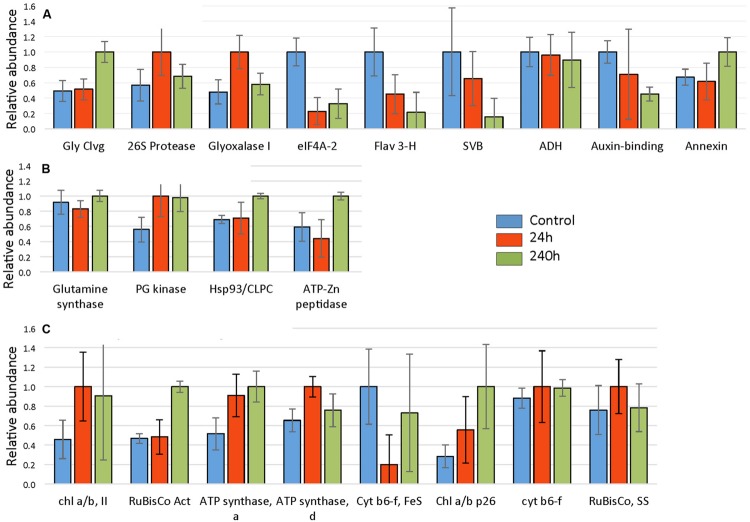
FIGURE 8.
Cold responses of twenty-one identified proteins. Spot intensities were normalized to the highest expressor (i.e., the highest level of each protein was considered to be 1.0) and represent the average values of 3 gels (three replicate experiments) with error bars indicating standard deviations. Proteins were categorized into (A) non-chloroplastic, (B) chloroplastic metabolism, and (C) photosynthesis-related chloroplast proteins. Proteins identified and corresponding spot numbers were Gly Cleavage enzyme (SSP 0005), chl a/b, II (SSP 0110), RuBisCo Activase (SSP 0403), 26S protease regulatory subunit (SSP 1114), ATP synthase, alpha (SSP 1606), ATP synthase, delta (SSP 2004), Glyoxalase I (SSP 2208), Glutamine synthase (SSP 2405), eIF4A-2 (SSP 2507), Cyt b6-f, FeS (SSP 3007), Chl a/b p26 (SSP 3109), fumaryl acetase-like (SSP 3502), Hsp93/CLPC (SSP 3801), cyt b6-f FeS (SSP 4004), Flavanone 3 hydroxylase (SSP 4403), ATP-Zn peptidase, (SSP 4817), unknown, stress related (SSP 6711), alcohol dehydrogenase (SSP 7408), Auxin-binding (SSP 8004), RuBisCo, SS (SSP 8005).

