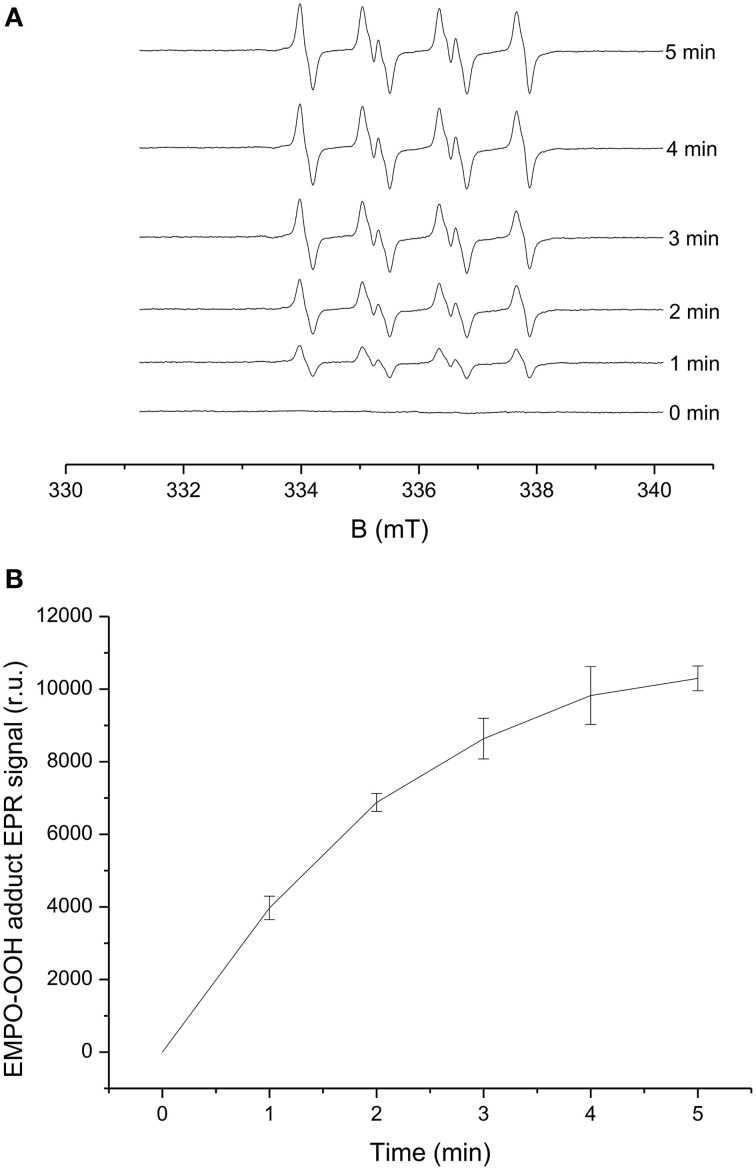
Figure 1.
Light-induced EMPO-OOH adduct EPR spectra measured in PSII membranes. EMPO-OOH adduct EPR spectra were measured under light illumination (1000 μmol photons m−2 s−1) of PSII membranes (150 μg Chl ml−1) in the presence of 25 mM EMPO, 100 μM desferal, and 40 mM phosphate buffer (pH 6.5). (A) Shows the spectra measured in the time range of 0–5 min of illumination and 1 (B) shows time profile of EMPO-OOH adduct EPR spectra. The intensity of EPR signal was evaluated by measuring the relative height of central peak of the first derivative of the EPR absorption spectrum. The data represent the mean value (±SD) where n = 3.

