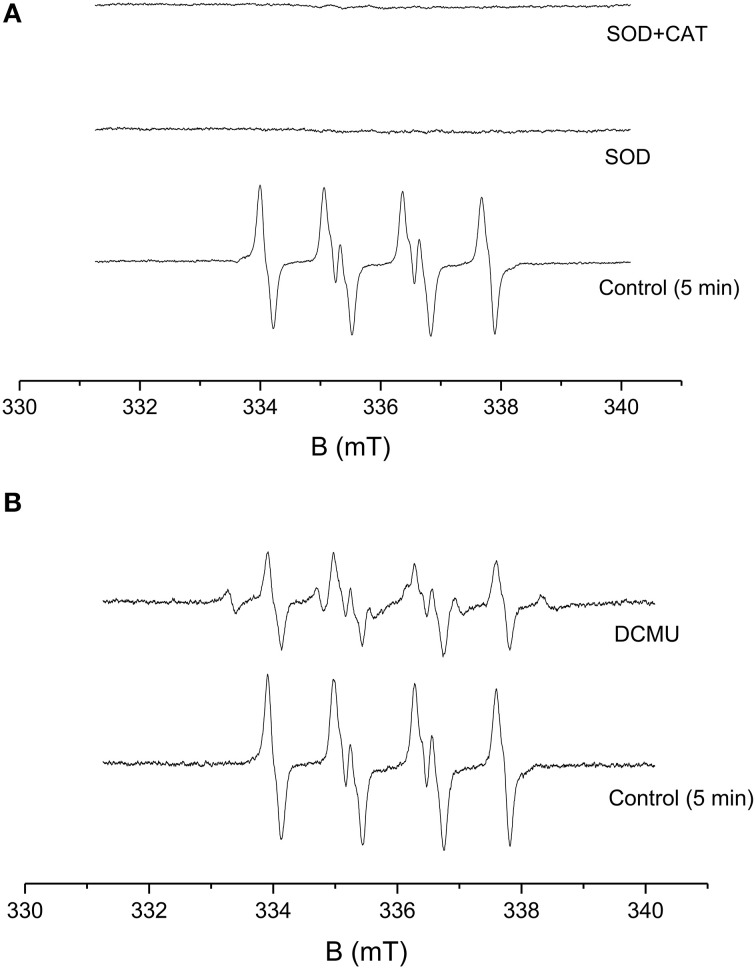
Figure 2.
Effect of SOD, CAT, and DCMU on EMPO-OOH adduct EPR spectra measured in PSII membranes. EMPO-OOH adduct EPR spectra were measured in PSII membranes in the presence of SOD and CAT under light illumination. The relative intensity of the light-induced EMPO-OOH adduct EPR signal measured in the presence of SOD (400 U/ml) and SOD+CAT (400 U/ml each) (A) and DCMU (20 μM) (B). The other experimental conditions were the same as described in Figure 1.

