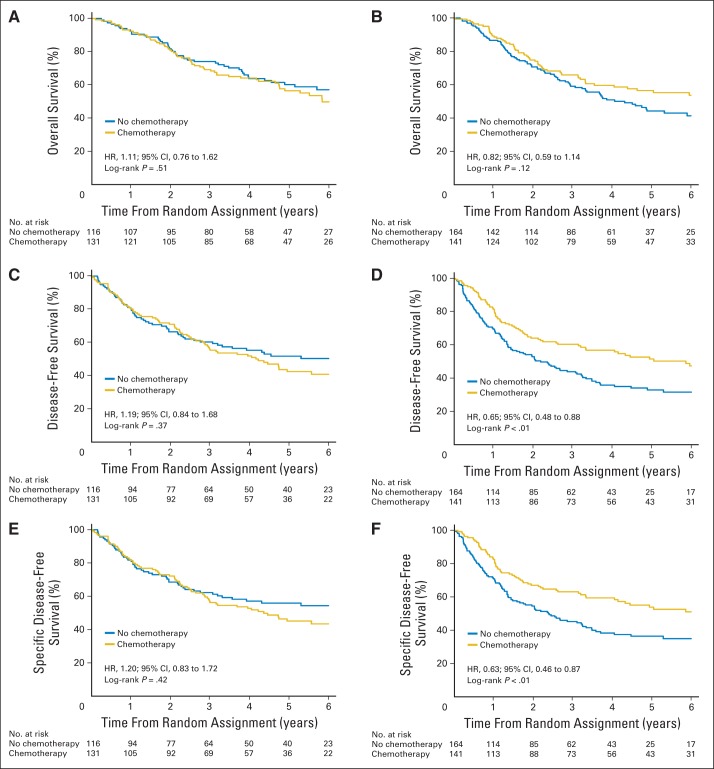
Fig 3.
Survival curves according to treatment arm (chemotherapy v observation) in (A, C, E) acinar/papillary and (B, D, F) micropapillary/solid subgroups for (A, B) overall, (C, D) disease-free, and (E, F) specific disease-free survival. P values from log-rank test and hazard ratio (HR) and 95% CIs of treatment effect, estimated through univariable Cox model stratified on trial, were reported for each subgroup and end point.

