Figure 2.

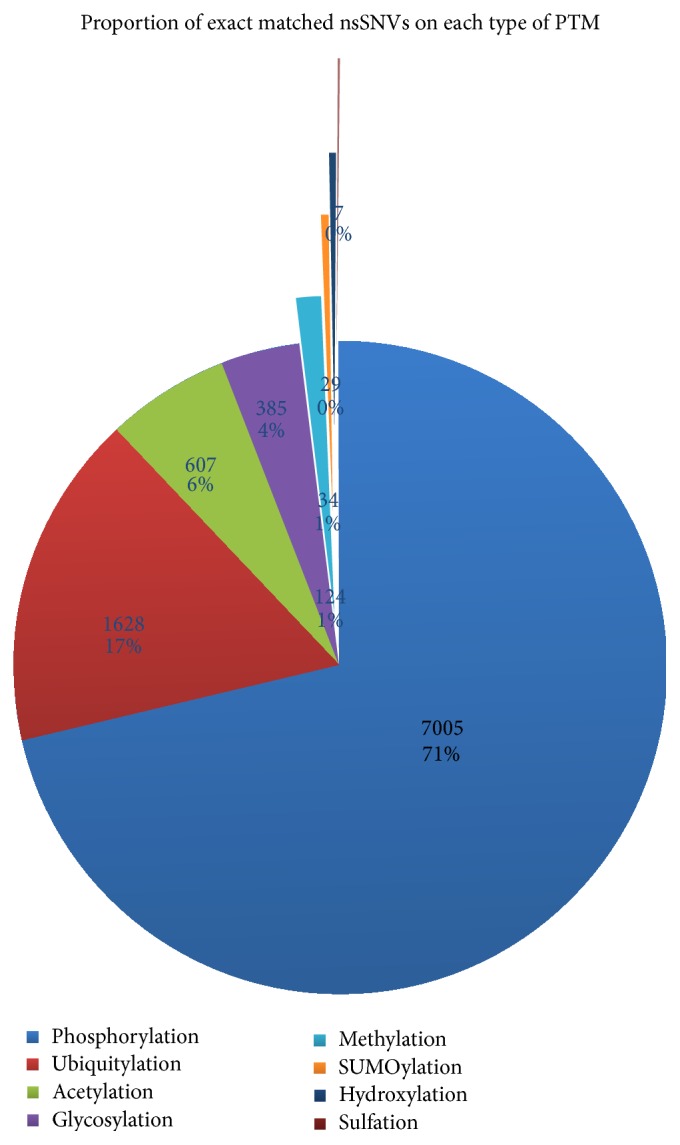
Proportions of exact matched nsSNVs on each PTM out of all sites analyzed. Both the exact number of sites affected and the proportion are shown.

Proportions of exact matched nsSNVs on each PTM out of all sites analyzed. Both the exact number of sites affected and the proportion are shown.