Figure 1.

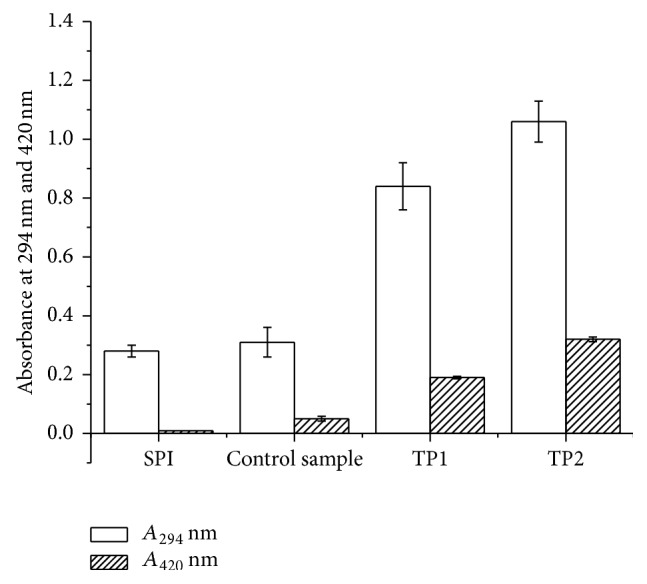
A 294 and browning intensity analysis of SPI and SPI-dextran solution treated by heat and TiO2 photocatalysis (control sample, TP1 and TP2). The data with different lowercase letters in the same test are significantly (P < 0.05) different.

A 294 and browning intensity analysis of SPI and SPI-dextran solution treated by heat and TiO2 photocatalysis (control sample, TP1 and TP2). The data with different lowercase letters in the same test are significantly (P < 0.05) different.