Figure 2.

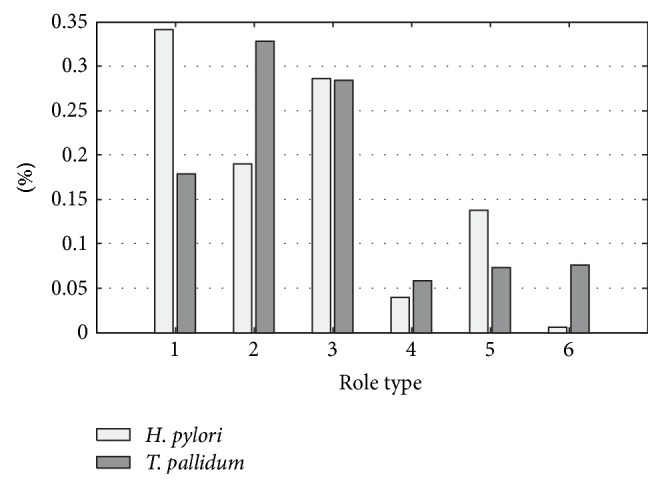
The distribution of role type of the reactions for T. pallidum and H. pylori. x-axis indicates the type of reactions; and y-axis indicates the percentage of reactions in the corresponding type.

The distribution of role type of the reactions for T. pallidum and H. pylori. x-axis indicates the type of reactions; and y-axis indicates the percentage of reactions in the corresponding type.