
Figure 3.
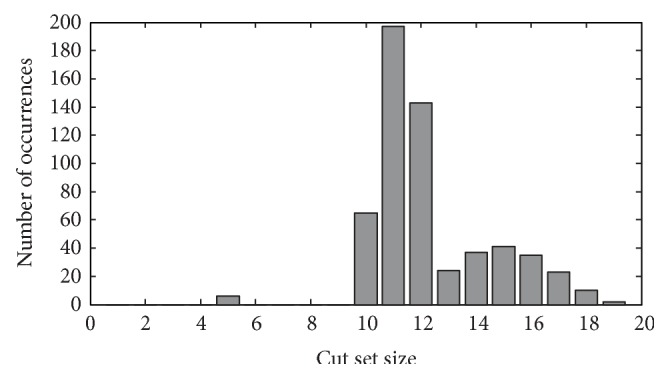
The distribution of the cut set size. x-axis indicates the number of reactions in one minimal cut set; and y-axis indicates the number of minimal cut sets that have that amount (indicated by x-axis) of reactions.
Official websites use .gov
A
.gov website belongs to an official
government organization in the United States.
Secure .gov websites use HTTPS
A lock (
) or https:// means you've safely
connected to the .gov website. Share sensitive
information only on official, secure websites.
The distribution of the cut set size. x-axis indicates the number of reactions in one minimal cut set; and y-axis indicates the number of minimal cut sets that have that amount (indicated by x-axis) of reactions.