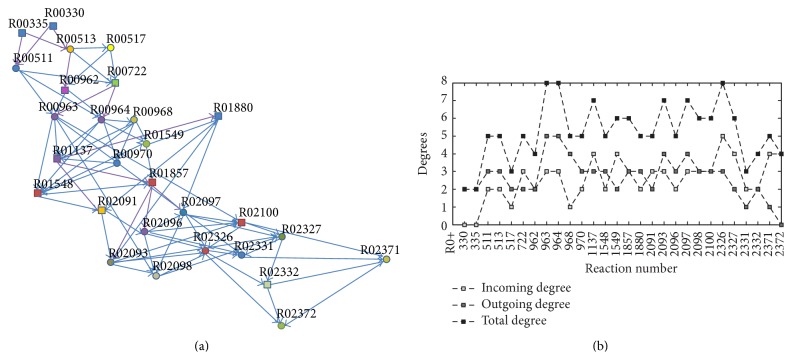
Figure 4.
The paths and degrees of reactions in minimal cut sets. (a) Rectangle nodes indicate reactions in purine metabolism; circular nodes indicate reactions in pyrimidine metabolism. The directed edges show the distinct pathways in the minimal cut sets which cannot be reduced further towards the objective reaction. (b) x-axis indicates the reactions' ID in KEGG; y-axis indicates the degrees of reactions.

