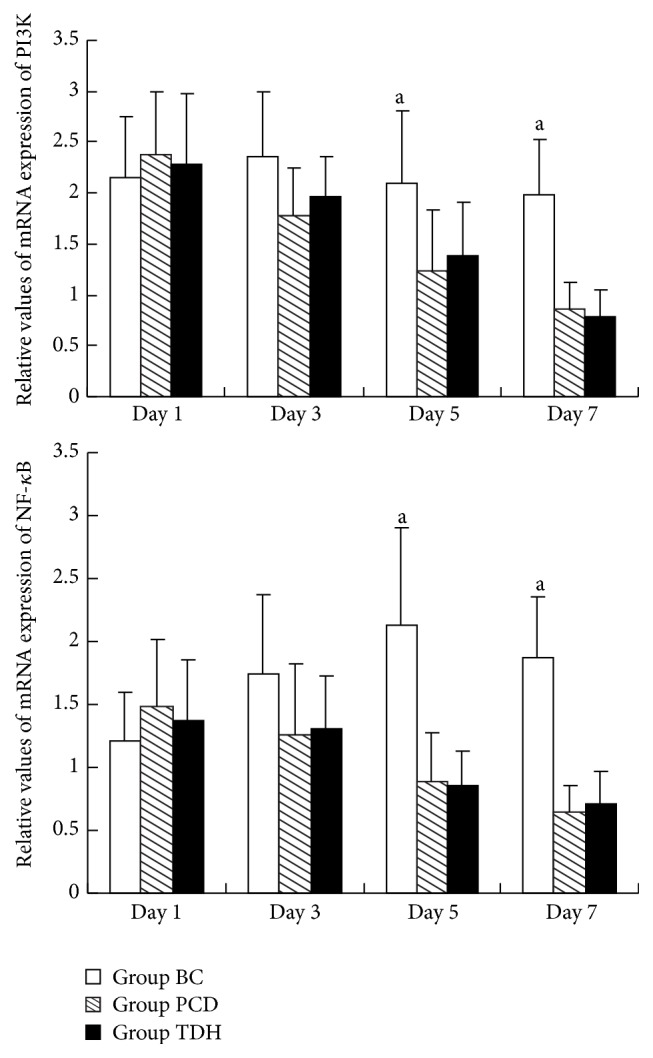
Figure 4.

Comparison of PI3K mRNA and NF-κB mRNA expression in cells affected by TDH and 5 FU at different time points RT. The determination method is fluorescence quantitative PCR assay. Manipulation accords to kit's instruction. Data are analyzed by LSD test, a P < 0.05 versus Group BC. Results are considered statistical significance at P < 0.05. Three samples are observed in each group. The dosage of drugs is as follows: in Group BC, RPMI 1640 containing 10% CS; in Group PCD, RPMI 1640 containing 5 FU 10 mg·mL−1; in Group TDH, RPMI 1640 containing TDH 10 mg·mL−1.
