
Figure 11.
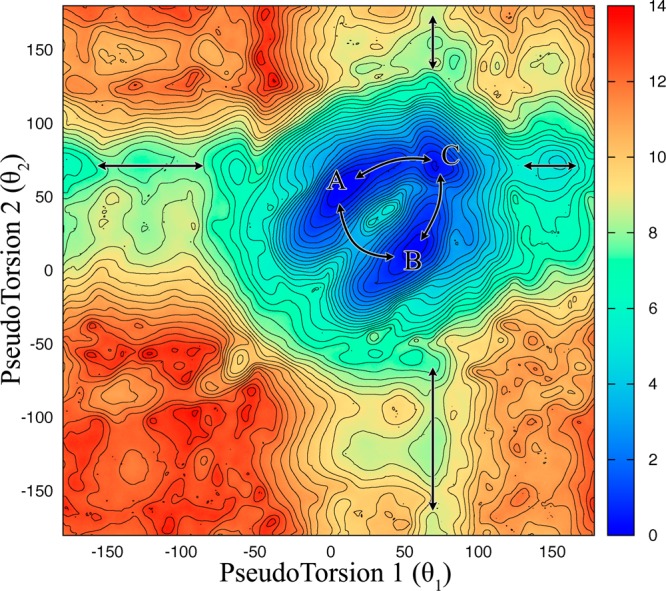
2D (θ1,θ2) PMF surface predicted for 1×1 UU base pairs by umbrella sampling calculations. Double-ended arrows indicate the channels directing the stacking and unstacking of uridine in a 1×1 UU base pair. The lowest free energy states describe different stacked 1×1 UU base pair conformations. A and B represent a mix of 2 and 1 hydrogen-bond states, while C represents a mix of 1 and 0 hydrogen-bond states (see Figure S9 for hydrogen-bond analyses).