
Figure 3.
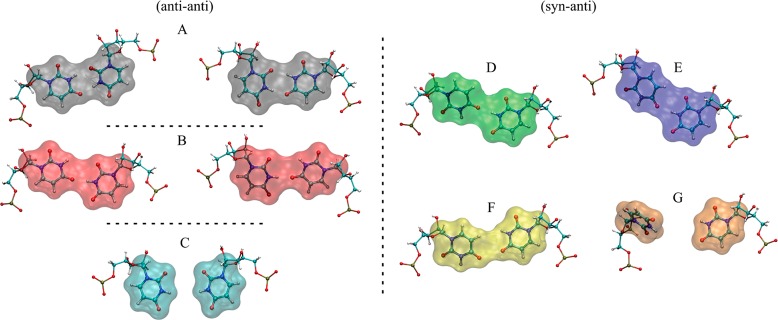
Conformational states of 1×1 UU base pairs seen in MD trajectories of 3×CUG3SYW and 3×CUGinf. Color notation was used to represent each state to make visualization of rmsd plots (vide infra) easier. Black (A), red (B), and cyan (C) represent anti–anti conformations with 2, 1, and 0 hydrogen-bond. Green (D), blue (E), yellow (F), and orange (G) are used for syn–anti conformations. Note that, in anti–anti UU conformations, the system is symmetric. As a result, there are two conformations each in A and B representing the same state.