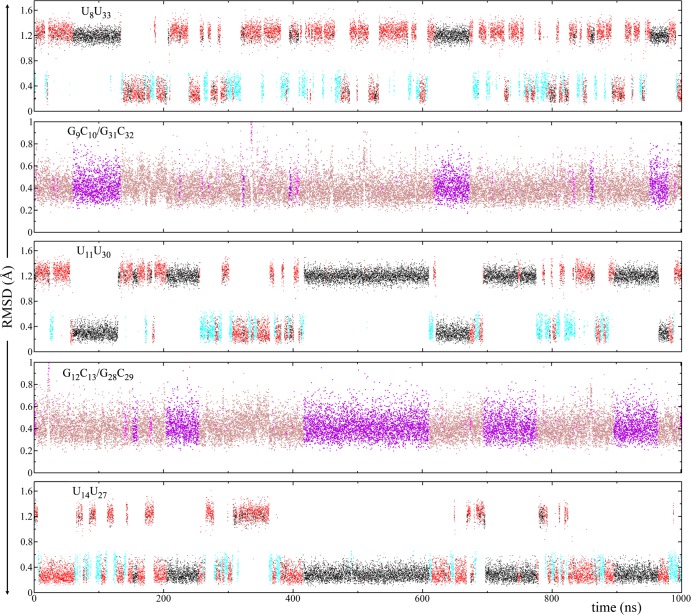
Figure 4.
Rmsd analysis of 3×CUG3SYW. See Figure 1B for residue numbering. Rmsd’s (in Å) of U8U33, G9C10/G31C32, U11U30, G12C13/G28C29, and U14U27 are plotted with respect to the stable conformations shown in Figures 3 and 5. Note that all the UU base pairs are in anti–anti conformations with stable forms represented by black, red, and cyan (Figure 3A–C, and Movie S1). In the rmsd analysis of the 1×1 UU base pairs (U8U33, U11U30, and U14U27), conformational states with rmsd greater than 1 Å represent symmetry related versions of the states. As noted in Figure 3, UU base pairs in states colored black and red have two identical conformations representing 2 and 1 hydrogen-bond states, respectively. The plots were created in this form to display the transformations of 1×1 UU base pairs during the trajectory. Note also that the stable GC/CG conformation represented by magenta only forms when the flanking 1×1 UU base pairs are both in the 2 hydrogen-bond and opposite symmetry states (black) (see Movie S2).

