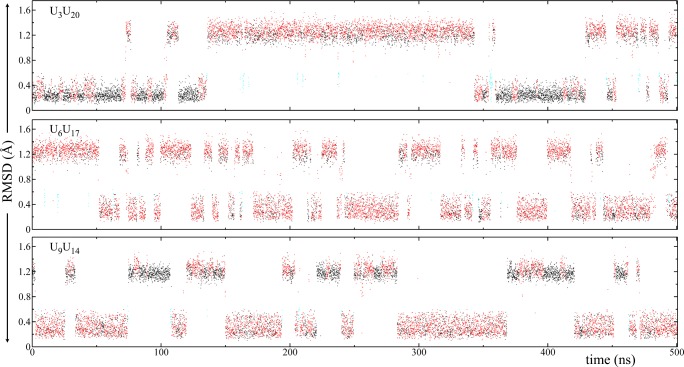
Figure 7.
RMSD analysis of 1×1 UU base pairs seen in the 3×CUGinf/anti–anti MD simulation (See Figure 1C for residue numbering). The initial structures of all the UU base pairs were in anti–anti. The color scheme described in Figure 3 was used to display the conformational transformations. Note that black and red conformations (Figure 3) represent 2- and 1-hydrogen-bond states, which can be described by two symmetric orientations (Figure 3A,B). Rmsd states greater than 1 Å represent the symmetry related orientations.

