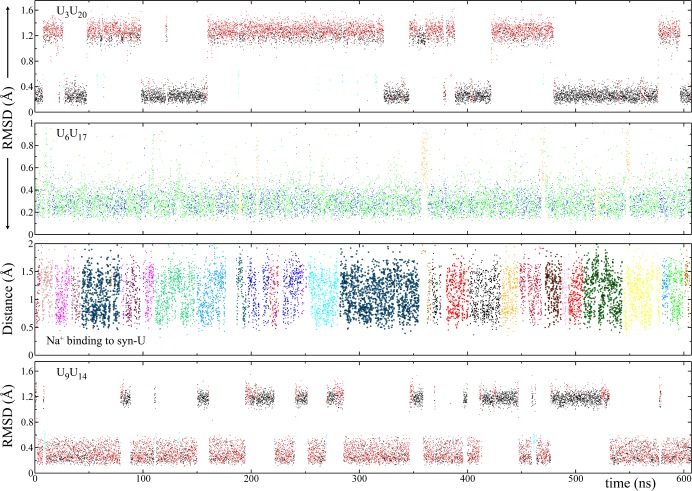
Figure 8.
Rmsd of 1×1 UU base pairs and Na+ binding to the pocket seen in 3×CUGinf/syn–anti MD simulations (see Figure 1C for residue numbering). The initial structures of the terminal UU base pairs, U3U20 and U9U14, were anti–anti, while U6U17 was syn–anti. The color scheme described in Figure 3 was used to display conformational transformations of the UU base pairs. See Figure 7 caption for details of the rmsd analysis. A Na+ binding pocket was observed near U6 when it was in the syn conformation (Figure 9). In the Na+ binding analysis different colors represent different Na+ ions in the system where the distance between each ion and the center-of-mass (COM) of the three atoms shown in Figure 9 (O2P and O2 of U6, and N7 of G7) were calculated. Note that when the binding pocket was not occupied by a Na+ ion, U6 tried to unstack from the helical axis and transformed to the orange state (Figure 3G). However, this state was short-lived, and no syn ↔ anti transformation was observed (Movie S4).

