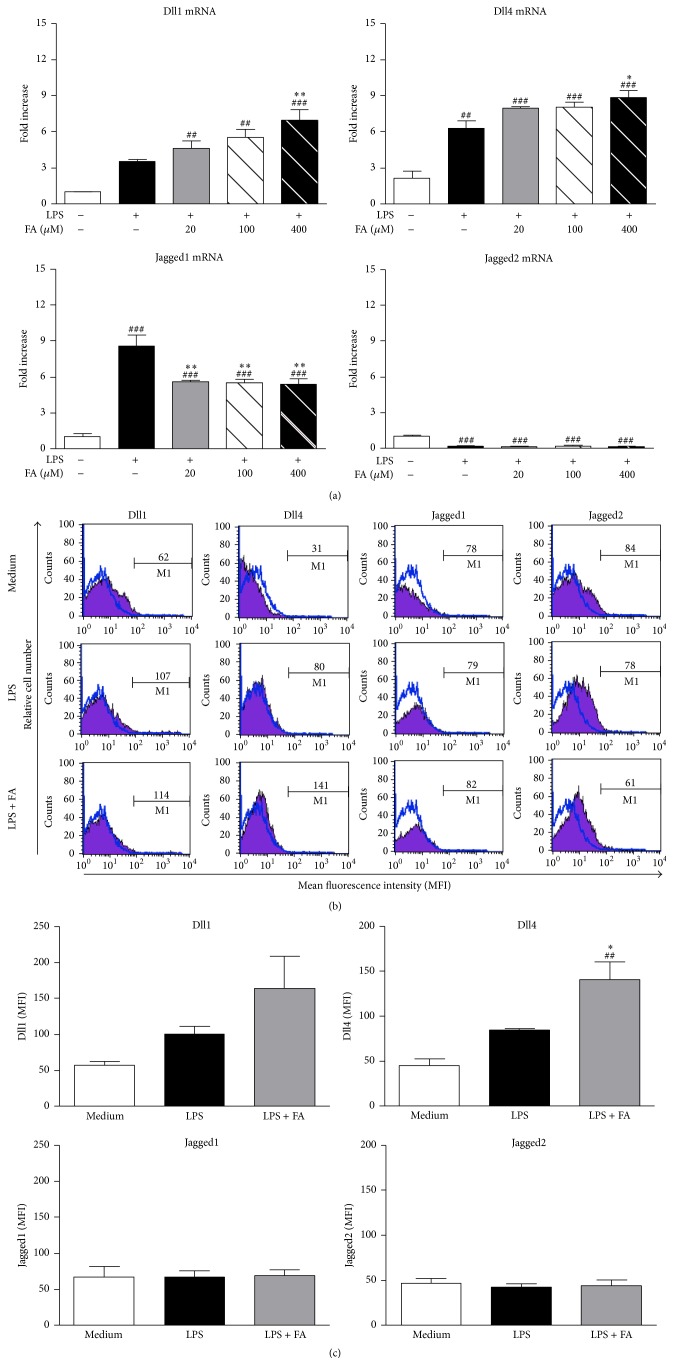
Figure 2.
Effects of ferulic acid on expressions of Notch ligands in lipopolysaccharide-stimulated dendritic cells. (a) On day 6 of culture, BMDCs were left untreated or treated with LPS (1 μg/mL) alone or LPS plus various concentrations of FA (20, 100, and 400 μM). Untreated immature DCs served as the medium group. Cells were harvested after 5 h, and Jagged1, Jagged2, Dll1, and Dll4 mRNA accumulations were measured using a real-time RT-PCR. Results from three independent experiments are shown, and results are expressed as the mean ± SEM. ## p < 0.01, ### p < 0.001 versus medium-treated DCs. ∗ p < 0.05, ∗∗ p < 0.01, and ∗∗∗ p < 0.001 versus LPS-treated DCs. (b) Medium-treated DCs, LPS-treated DCs, and FA (400 μM) plus LPS-treated DCs were cultured for 24 h. Then cells were harvested, and surface Notch ligand expressions were analyzed by flow cytometry. Each histogram shown is from one representative experiment performed. Values shown in the flow cytometric profiles are the mean fluorescence intensity (MFI) indexes. Cells were gated on CD11c, and the incidence of CD11c+ cells expressing the Notch ligands is indicated within each histogram. (c) The quantification of surface Notch ligand expressions is analyzed by flow cytometry. Results from three independent experiments are shown and are expressed as the mean ± SEM. ## p < 0.01 versus medium-treated DCs. ∗ p < 0.05 versus LPS-treated DCs.

