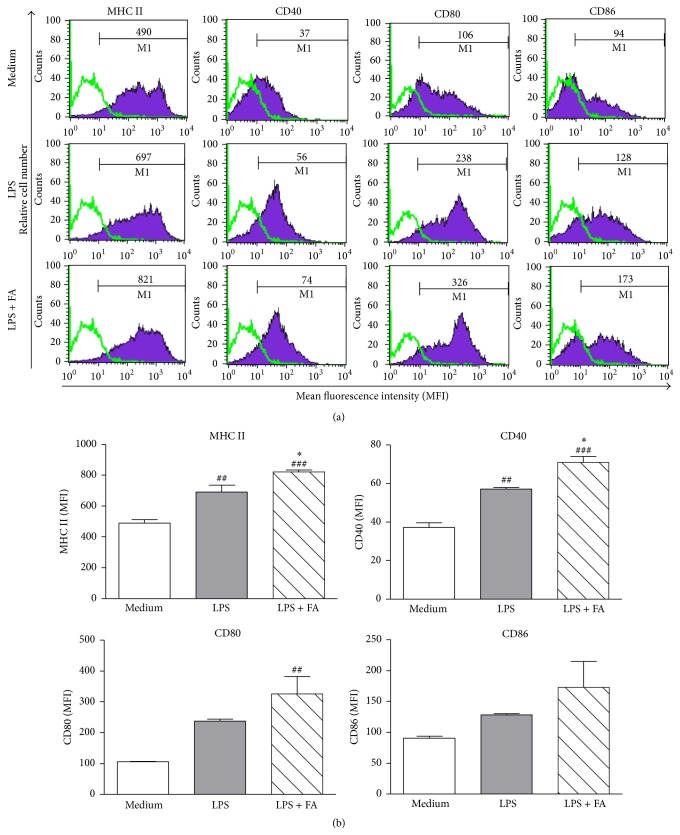
Figure 3.
Ferulic acid treatment affects the maturation phenotype of lipopolysaccharide-stimulated dendritic cells. DCs were treated with medium, LPS (1 μg/mL) alone or LPS plus FA (400 μM) for 24 h. After incubation, cells were collected, and expressions of MHC class II, CD40, CD80, and CD86 by DCs were analyzed using flow cytometry. (a) Values shown in the flow cytometric profiles are the mean fluorescence intensity (MFI). Cells were gated on CD11c, and the incidence of CD11c+ cells expressing the surface marker is indicated within each histogram. Values shown are from one representative experiment of three independent experiments performed. (b) The MFI was calculated, and results are expressed as the mean ± SEM from three independent experiments. ## p < 0.01, ### p < 0.001 versus medium-treated DCs. ∗ p < 0.05, ∗∗∗ p < 0.001 versus LPS-treated DCs.

