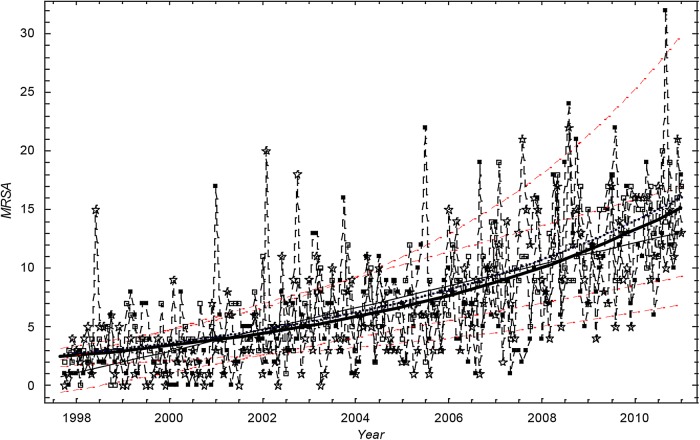
Figure 1.
The monthly number of methicillin-resistant Staphylococcus aureus cases in Oslo County: September 1997 to 2010. Thick black curve:  based on exponential LSF of data. Thin black curve:
  based on linear LSF of data. Red dashed curve: 95% confidence bounds for exponential and linear LSF of the data. Blue curve:
  based on exponential LSF of simulated data. ▪: Data, □: Stochastic simulation based on the Poisson distribution.⋆: Stochastic simulation based on the γ-Poisson distribution.

