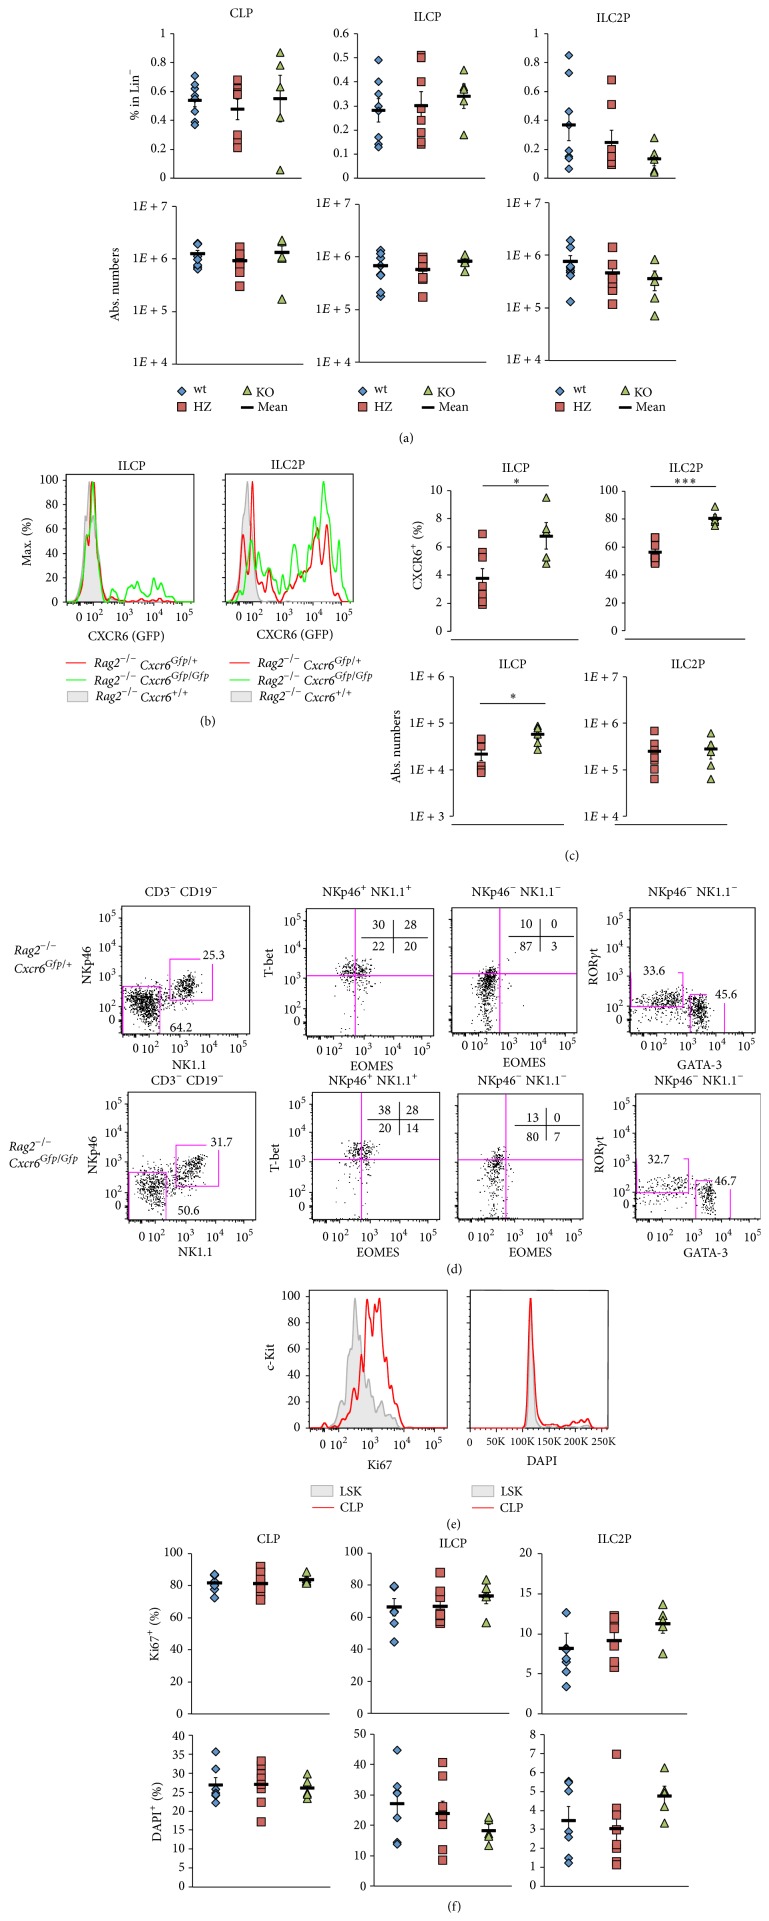
Figure 2.
CXCR6-deficient precursors are retained in the bone marrow. (a) Percentages in Lin− (upper panels) and absolute numbers (lower panels) of BM CLP, ILCP, and ILC2P as defined in Figure 1(a) from Rag2 −/− Cxcr6 +/+ (wt, blue losange), Cxcr6 Gfp/+ (HZ, red square), or Cxcr6 Gfp/Gfp (KO, green triangle) adult mice. (b) Histograms depicting levels of CXCR6-GFP in ILCP (left panel) or ILC2P (right panel) from Rag2 −/− Cxcr6 +/+ (filled gray), Cxcr6 Gfp/+ (red line), or Cxcr6 Gfp/Gfp (green line) bone marrows. (c) Percentages of CXCR6+ cells (upper panels) and absolute numbers of (lower panels) BM ILCP (left panels) and ILC2P (right panels) in Rag2 −/− Cxcr6 Gfp/+ (HZ, red square) or Cxcr6 Gfp/Gfp (KO, green triangle) adult mice. (d) Cell culture of BM ILCP from Rag2 −/− Cxcr6 Gfp/+ (upper panels) or Cxcr6 Gfp/Gfp (lower panels) adult mice. Each population is sorted and cultured at 20 cells per well on OP9-DL4 stromal cells with IL-7, c-KitL, and Flt3-L for 7 days and analyzed by flow cytometry. Indicated obtained progenies were analyzed for T-bet, EOMES, RORγt, and GATA-3 expression. (e) Histograms of BM LSK cells (filled gray, selected as Lin− IL-7Rα − c-Kithi Sca-1+) and CLP (red line) for Ki67 expression and DAPI levels. (f) Percentages of Ki67+ cells (upper panels) and DAPI+ cells (lower panels) among BM CLP, ILCP, and ILC2P in Rag2 −/− Cxcr6 +/+ (wt, blue losange), Cxcr6 Gfp/+ (HZ, red square), or Cxcr6 Gfp/Gfp (KO, green triangle) adult mice. Data are representative of at least 3 experiments ((b), (e): n > 5), or are from one experiment ((d), at least 4 wells of each conditions), or are from 3 pooled experiments ((a), (c), (f), wt: n = 8, HZ: n = 8, KO: n = 5). In ((a), (c), (f)), each dot represents a single mouse. Statistical data are displayed with mean and SEM (Student's unpaired bilateral test, ∗ p < 0.05; ∗∗ p < 0.01; ∗∗∗ p < 0.005).

