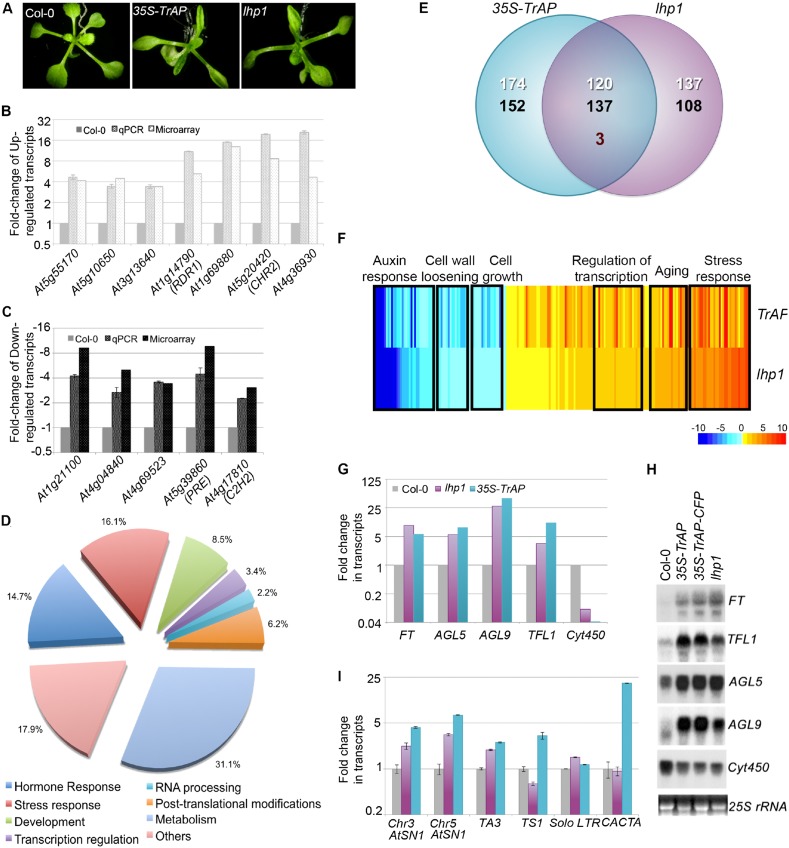
Figure 2. TrAP is genetically involved in the TGS pathway.
(A) 35S-TrAP transgenic plants phenocopied lhp1 mutants. Photographs were taken of 15-day seedlings. (B, C) Microarray results were validated by qRT-PCR analysis. Only 12 randomly selected loci were shown. (D) Gene ontology analysis of the TrAP-regulated DEGs. The numbers adjacent to the pies represent the ratio of genes in each category over the total DEGs. (E) Genome-wide overlapping of the genes regulated by TrAP and loss-of-function lhp1. White and black numbers correspond to upregulated and downregulated genes, respectively. Maroon number indicates the genes that are differentially deregulated in both genotypes. (F) Heatmap of the commonly deregulated genes in the 35S-TrAP and lhp1 lines. The typical gene-ontology categories are shown on top. (G, H) Microarray and RNA blot analyses of epigenetically regulated flowering genes in the TrAP transgenic lines and lhp1 mutants. Cyt450 is a control. (I) qRT-PCR analysis of TEs in heterochromatic regions in the lhp1 mutant and TrAP transgenic lines.

