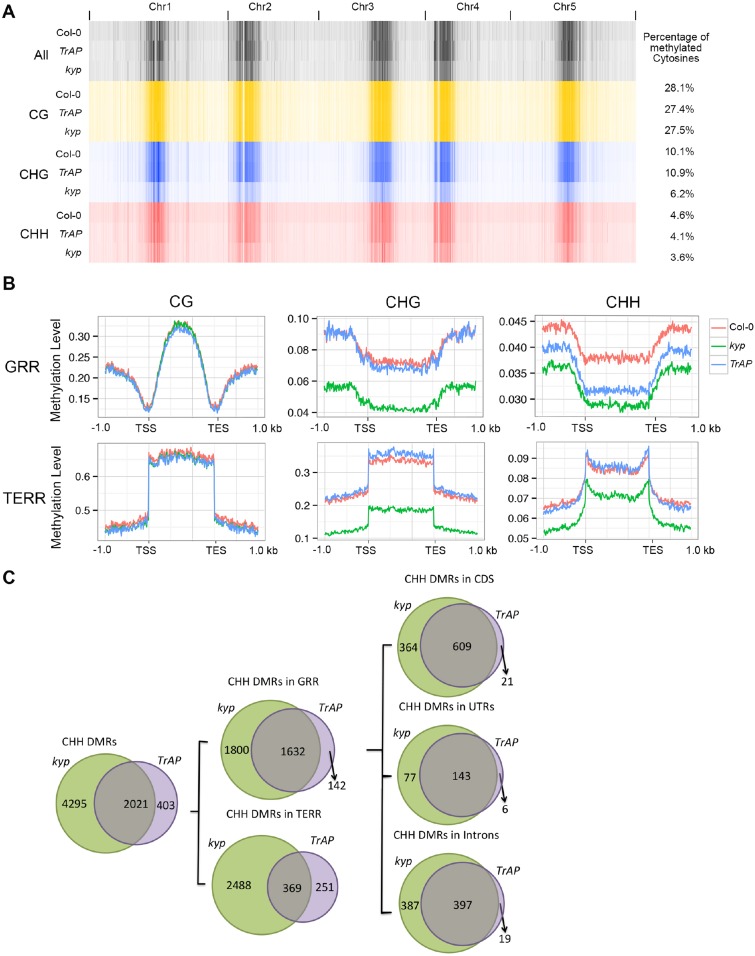
Figure 7. TrAP reduces CHH DNA methylation in vivo.
(A) Genome-wide heatmap of DNA methylation levels in Col-0, kyp mutant, and TrAP transgenic plants (Left). Sequence context of all cytosine, CG, CHG, and CHH methylation was depicted as black, yellow, blue, and red, respectively. The percentage of cytosine methylation is shown for each genotype (Right). (B) Average distribution of context-specific DNA methylation in Gene- and TE-rich regions in Col-0 (red), kyp mutants (green), and TrAP transgenic plants (blue). (C). Overlap of CHH DMRs between TrAP transgenic plants and kyp mutant.


